

Atmospheric Physics, Chemistry and Climate
Data
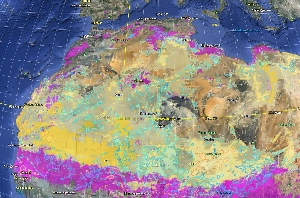 |
Natural, anthropogenic and hydrologic dust sourcesdescription: Dust sources detected from MODIS (Aqua) Deep Blue Level 2 aerosol products are attributed natural (yellow shading), anthropogenic (magenta shading) or hydrologic (blue shading) origin if at least 30% land use (anthropogenic) or 10% ephemeral water bodies (hydrologic) are present. units: % FoO Dust Optical Depth>0.2 |
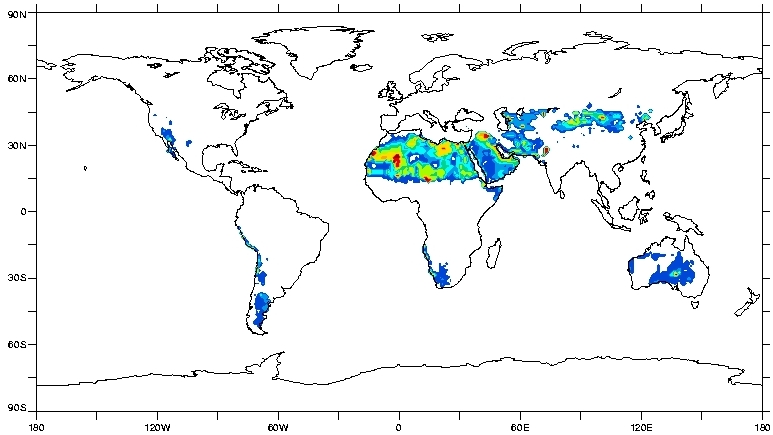 |
Dust source inventorydescription: fractional area of grid cell with erodible dust |
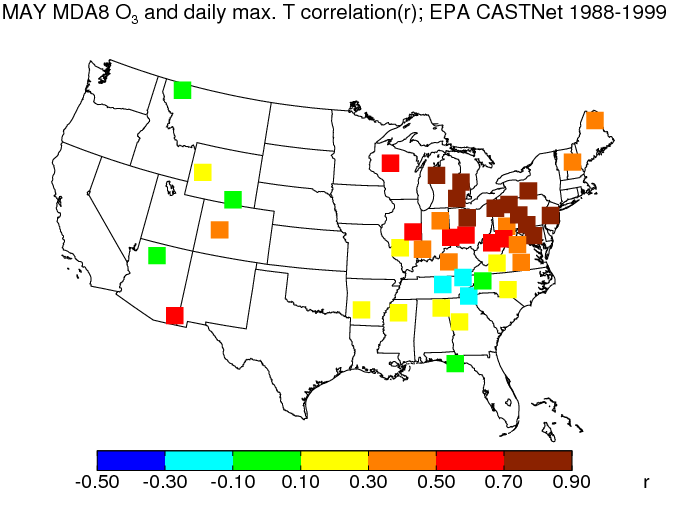 |
Ozone-temperature statisticsText files containing observed surface ozone-temperature statistics (Pearson correlation; slope of the best fit line between ozone and temperature) for each month at EPA CASTNet site locations over the entire United States as calculated with the methodology described in Rasmussen et al. (submitted; Atmos. Environ.) for before (1988-2002) and after (2002-2009) the eastern U.S. NOx SIP Call that reduced power plant NOx emissions roughly 50% between the two time periods. Columns in the text files read from left to right are: latitude (degrees North), longitude (degrees East), site elevation (meters), Pearson correlation coefficient, slope of the ozone-temperature relationship (ppb ozone per degree Kelvin/ Celsius), standard error of the slope of the ozone-temperature relationship (ppb ozone per degree Kelvin/Celsius), and the final column contains the number of months used in the calculation of the correlation coefficient and the slope of the ozone-temperature relationship. ozone-temperature statistics from EPA CASTNet (1988 to 2002) (.tgz format) ozone-temperature statistics from EPA CASTNet (2002 to 2009) (.tgz format) reference: Rasmussen et al. (submitted; Atmos. Environ.) |