February 24th, 2015
Key Findings
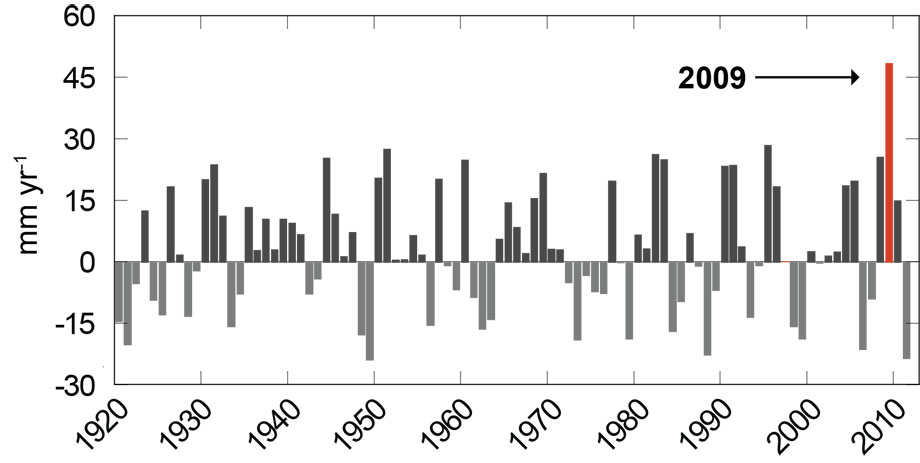
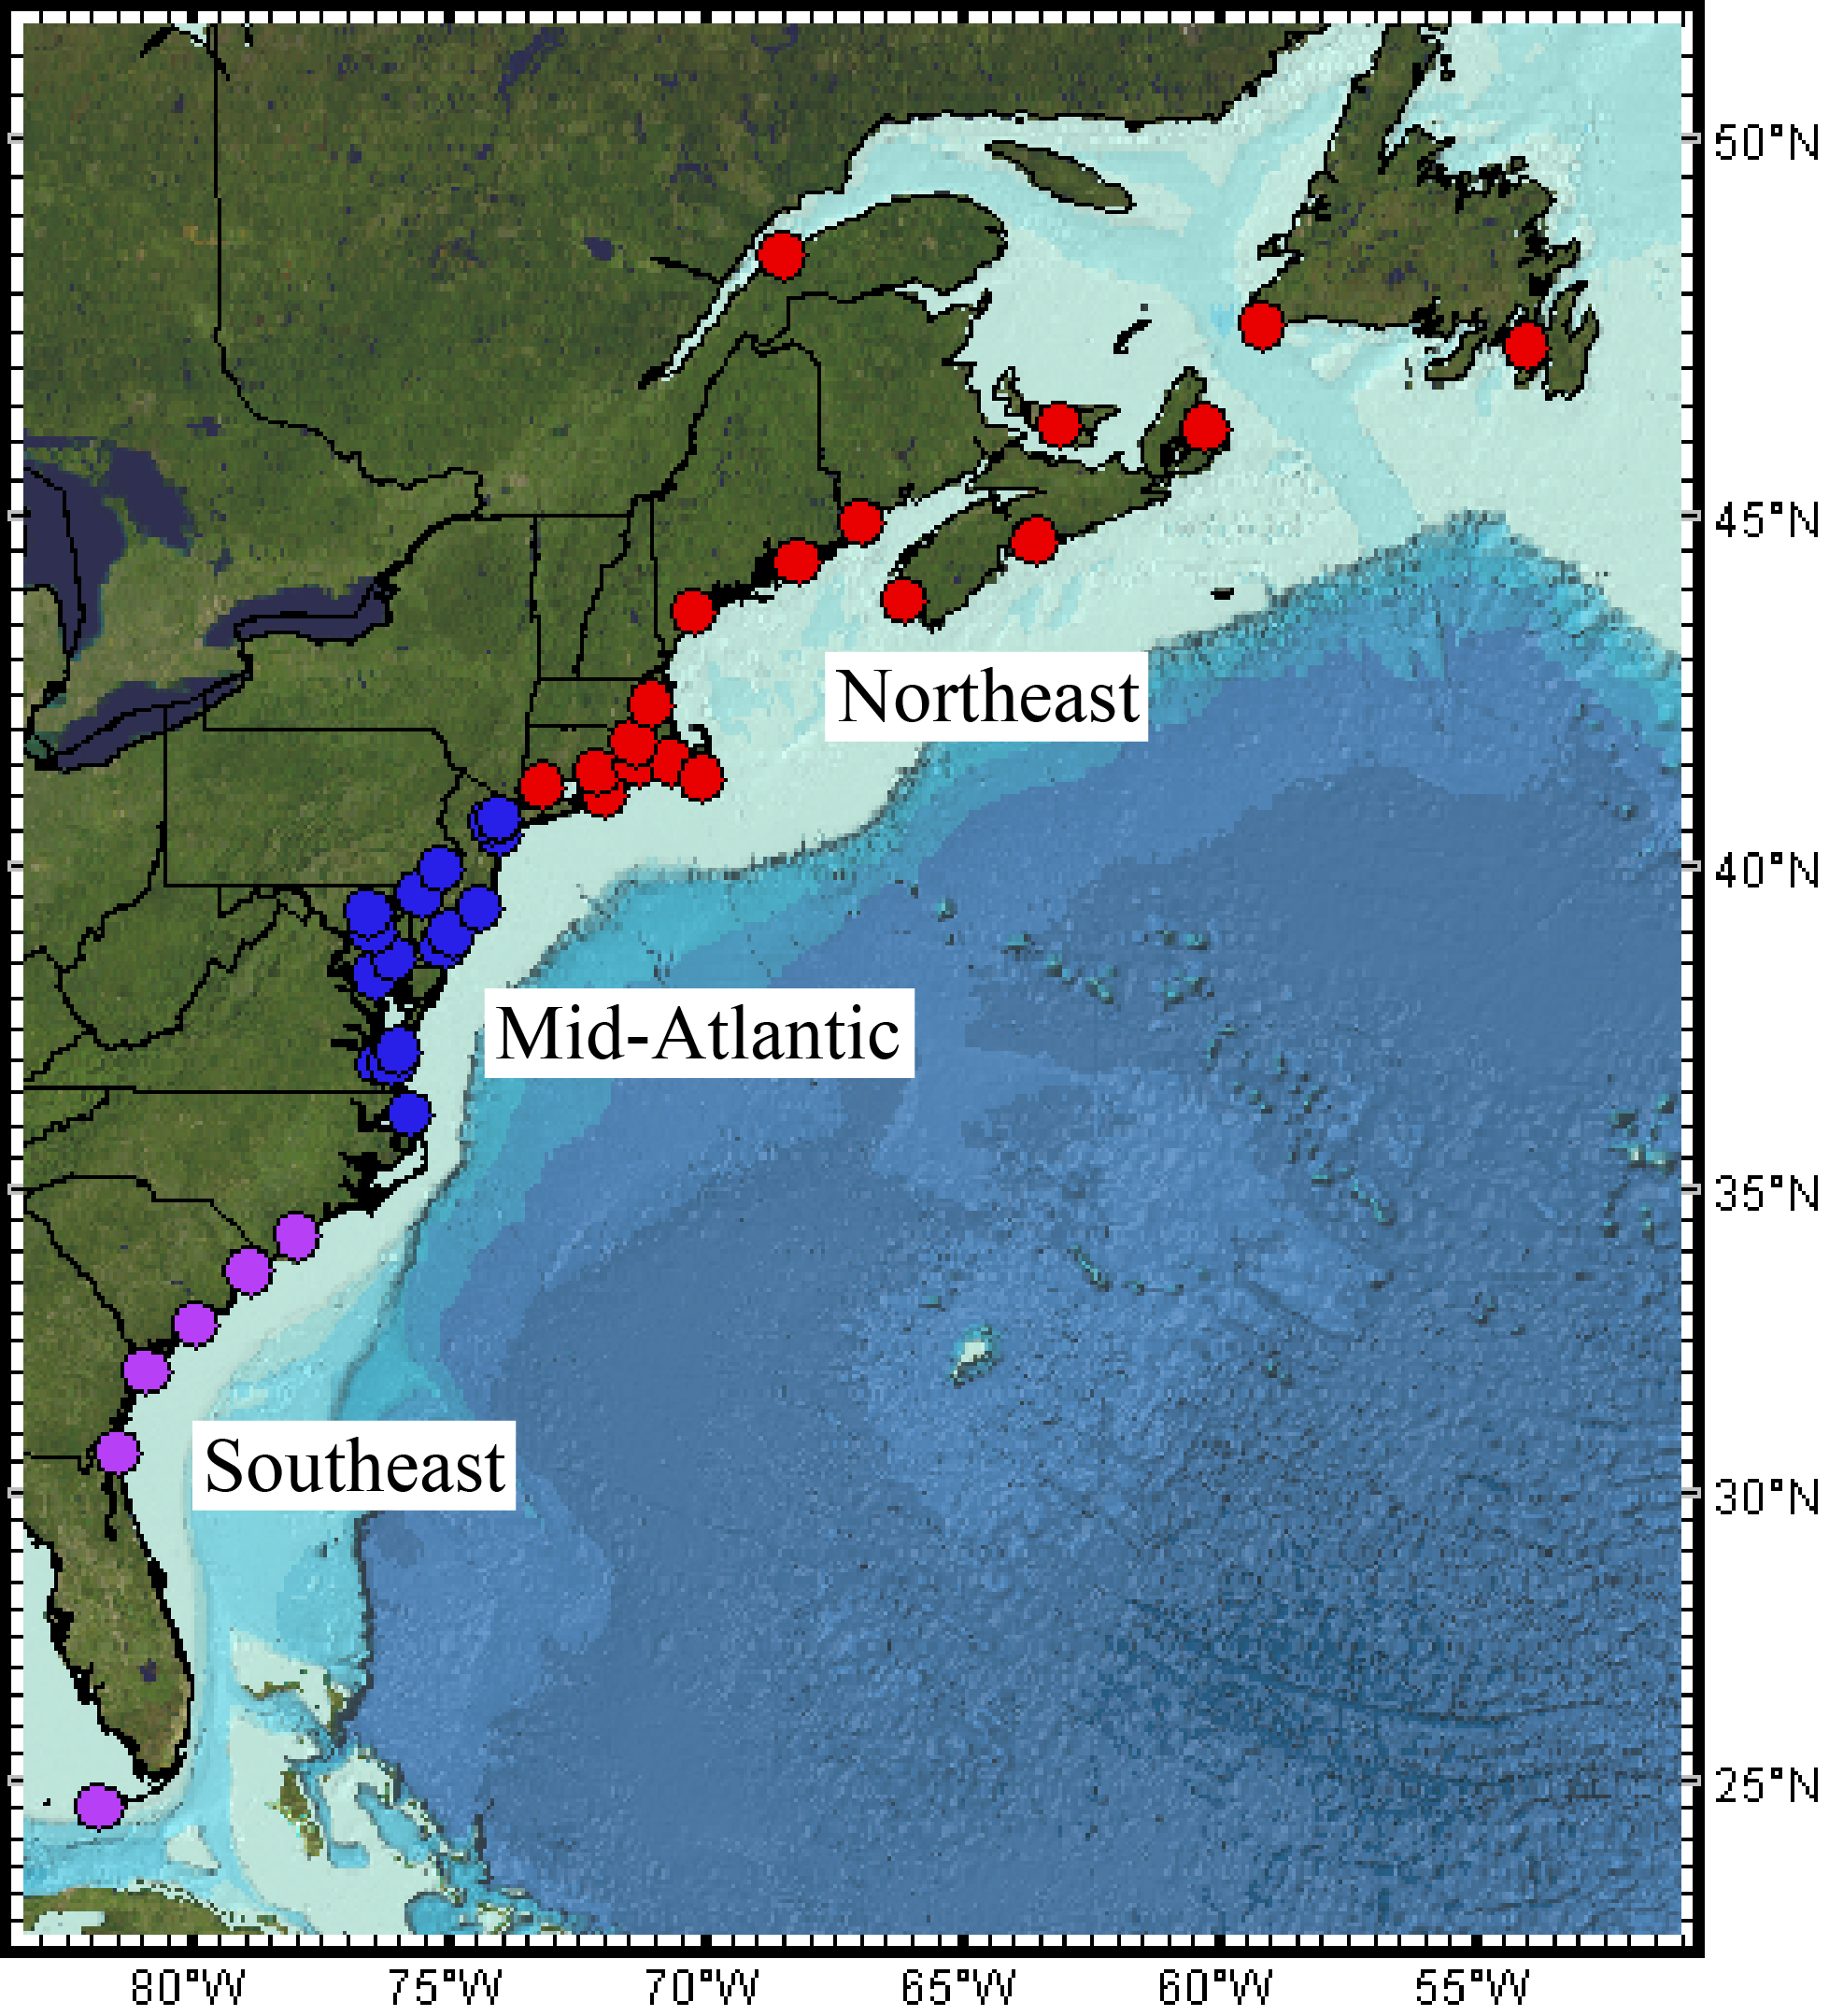
- From 2009 to 2010, coastal sea levels from New York City to Newfoundland jumped by 100 mm on average. This extreme yearly sea level rise rate is unprecedented in the tide gauge record, with statistical analysis suggesting it was a 1-in-850 year event based on past records.
- The extreme sea level rise event was closely related to an observed 30% downturn of the Atlantic Meridional Overturning Circulation (AMOC) from April 2009 to March 2010.
- The significant negative North Atlantic Oscillation (NAO) index in 2009-2010 contributed to the extreme SLR event.
- Climate models project an increase in magnitude and frequency of extreme interannual sea level rise events along the Northeast coast of North America over the 21st century.
Paul B. Goddard, Jianjun Yin, Stephen M. Griffies and Shaoqing Zhang. Nature Communications. DOI:10.1038/ncomms7346.
Summary
Coastal sea levels along continental margins often show significant year-to-year upward and downward fluctuations. These fluctuations are superimposed on a longer term upward trend associated with the rise in global mean sea level, with global mean sea level rising at roughly 3 mm per year during the recent 20 years of accurate satellite measures. For society, it is the regional changes along any particular coastal zone that are most important. Our analysis of multi-decadal tide gauge records along the North American east coast identified an extreme sea-level rise event during 2009–2010. Within this relatively brief two-year period, coastal sea level north of New York City jumped by up to 128 mm. This magnitude of inter-annual sea level rise is unprecedented in the tide gauge records, with statistical methods suggesting that it was a 1-in-850 year event.
We show that this extreme sea level rise event was a combined effect of two physical factors. First, it was partly due to an observed 30% downturn of the Atlantic meridional overturning circulation (AMOC) during 2009-2010. The AMOC is associated with large-scale currents of the North Atlantic, and it has been shown to impact various climate processes in the North American and European sectors, including coastal sea level. AMOC slowdown during 2009-2010 caused significant short-term changes in ocean temperatures and salinity east of North America, resulting in changes to ocean density and in turn imparting a rise in regional sea level. The extreme nature of the 2009-2010 sea level rise event suggests that such a significant AMOC downturn is very unusual in the past century.
The second contributing factor to the extreme sea level event was due to a significant negative North Atlantic Oscillation (NAO) index. The NAO index measures changes in the near-zonal winds that cross the North Atlantic region and affect much of the region’s weather patterns. The easterly or northeasterly wind anomalies associated with the significant negative NAO index in 2009-2010 acted to push ocean waters towards the Northeast Coast through a process known as “Ekman transport”, resulting in further rise in coastal sea levels in addition to that imparted by the AMOC downturn.
We consider projections of extreme sea level along the east coast of North America for later decades of the 21st century. For this purpose, we make use of a suite of climate/Earth system models developed at GFDL. These models included typical CMIP5-class models used for the 2013 IPCC climate assessment, as well as the newer GFDL climate models CM2.5 and CM2.6, both of which include higher resolution ocean mesoscale processes useful to better resolve coastal zones. In response to the increase in greenhouse-gas concentrations, each of these models show a reduction in the AMOC, which generally follows the behavior of the broader CMIP5 models. Given the observed connection between AMOC reduction and extreme coastal sea levels, the models thus project an increase in the magnitude and frequency of extreme sea level rise on interannual time scales along the Northeast Coast of North America.