

April 2nd, 2011
Key Findings
- Model biases with respect to clear-sky flux are shown to be strongly linked with corresponding biases in aerosol optical depth, while those with respect to all-sky flux are strongly linked to cloud amount.
- Modest linkage is found between the flux biases and how well the surface temperature is simulated in the model.
The downward solar flux at the surface is an important component of the earth’s climate system, being a major factor governing the surface temperature and hydrologic cycle. The availability of derived flux climatologies from both ground-based measurements and satellite-based estimates provide a reference for properly assessing general circulation model biases, not only in the surface irradiance, but in the atmospheric factors (aerosols, clouds, and water vapor) affecting it.
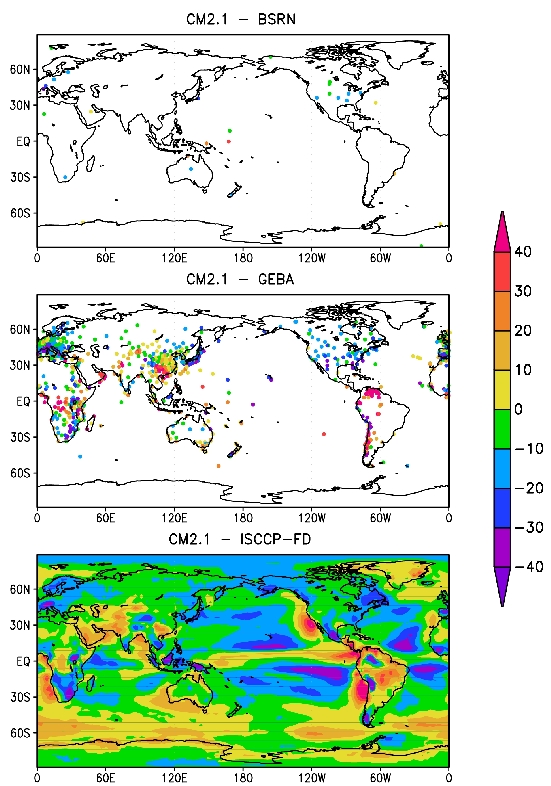
Figure 1 illustrates the biases in the annual mean all-sky downward shortwave surface flux in CM2.1 with respect to the climatologies derived from three datasets, while Figure 2 illustrates the corresponding biases in the total cloud amount. For land regions, over Europe, northern and eastern Asia and North America, the model produces large flux underestimates, with maximum values > 20 W/m2. These result from the model producing too much cloudiness over regions where there is frequent cloud cover. For southern Africa, flux underestimates are an indication that the model can also be too moist for drier regions as well. Contrastingly, flux overestimates, associated with too little cloudiness, occur over equatorial Africa, coastal regions of Australia, southern Asia, and especially for the Amazon region.
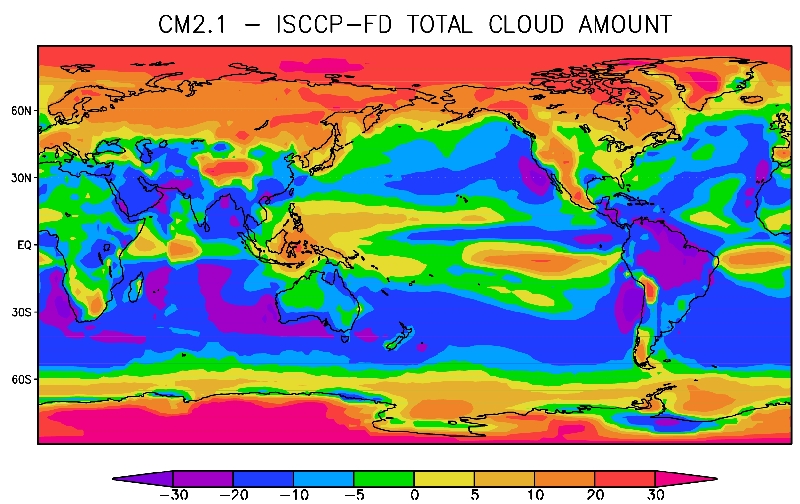
For oceanic regions, there are flux underestimates in the subtropical Pacific and Atlantic, and overestimates near and along the equator. The large biases just south of the equator are indicative of a double ITCZ produced by CM2.1. The flux overestimates off the west coast of the Americas are due to a lack of marine stratocumulus. Overestimates occur across the southern ocean from around 60oS southward to coastal Antarctica, due to too much cloudiness. Thus, the analysis of these flux biases aid in the identification of where and to what degree shortcomings in the model’s simulation of cloudiness exist, serving as a guide in seeking to improve the surface flux simulation.
For more information: Freidenreich, Stuart, and V Ramaswamy (2011), Analysis of the biases in the downward shortwave surface flux in the GFDL CM2.1 General Circulation Model. Journal of Geophysical Research, 116, D08208, doi:10.1029/2010JD014930.