

NOAA-GFDL & the 2014 Global Forever Stamp
From scientific research tool to postal artwork
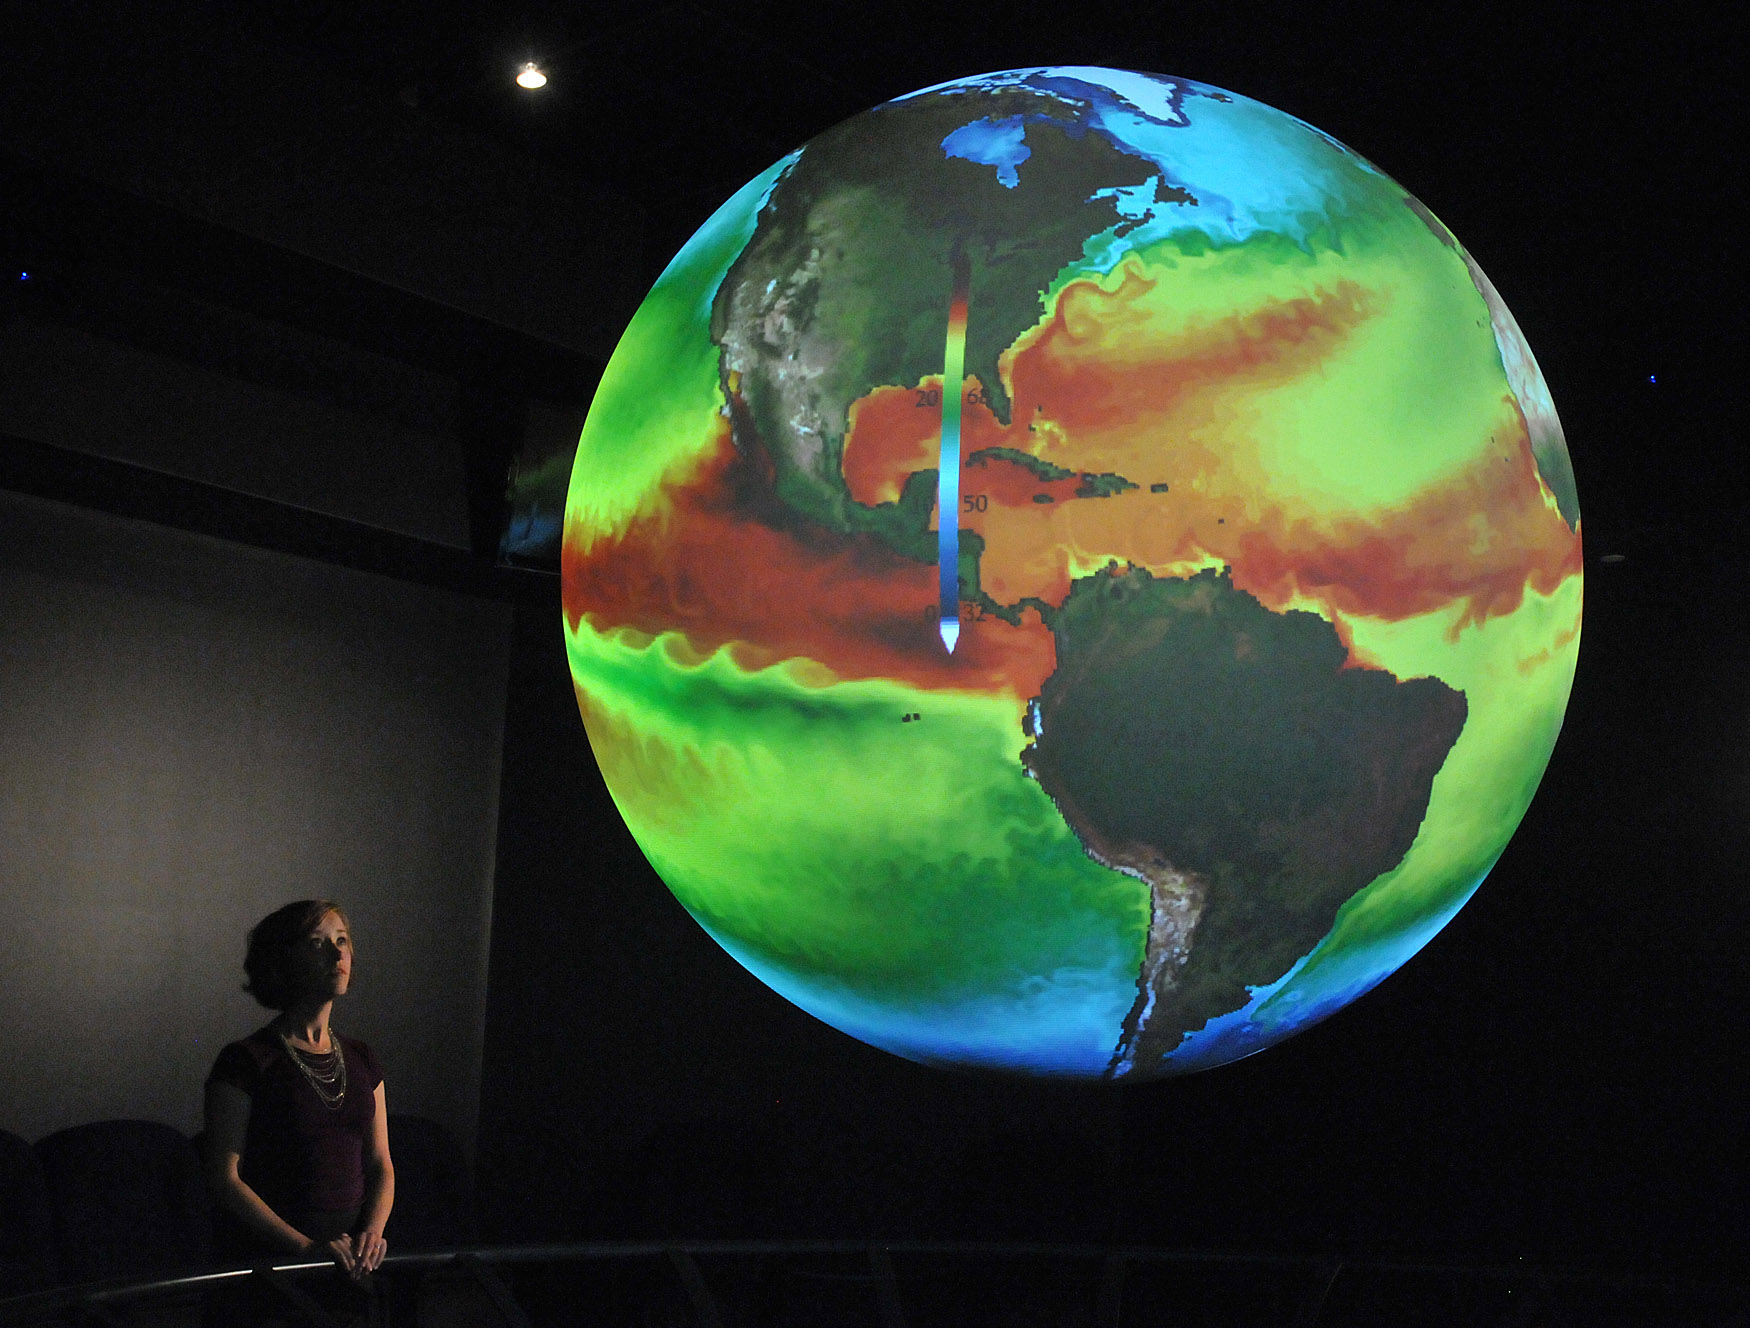
![[USPS 2014 Global Forever Stmap]](/wp-content/uploads/pix/user_images/kd/Forever_Intl_2014/GlobalForever2014.png) The sea surface temperatures (SSTs) shown on the US Postal Service’s 2014 Forever® international rate stamp are the product of a global climate model – a big and complex computer program – that divides our planet’s ocean, atmosphere, and land into tens of million of boxes (or grid cells) and applies the laws of physics as we understand them to each of those grid cells. More specifically, the colorful image depicts SSTs for a July day as simulated by a state-of-the-art climate model developed by researchers at the National Oceanographic & Atmospheric Administration’s (NOAA) Geophysical Fluid Dynamics Laboratory (GFDL) located in Princeton, New Jersey.
The sea surface temperatures (SSTs) shown on the US Postal Service’s 2014 Forever® international rate stamp are the product of a global climate model – a big and complex computer program – that divides our planet’s ocean, atmosphere, and land into tens of million of boxes (or grid cells) and applies the laws of physics as we understand them to each of those grid cells. More specifically, the colorful image depicts SSTs for a July day as simulated by a state-of-the-art climate model developed by researchers at the National Oceanographic & Atmospheric Administration’s (NOAA) Geophysical Fluid Dynamics Laboratory (GFDL) located in Princeton, New Jersey.
At NOAA GFDL, we are delighted that U.S. Postal Service® and its Citizens’ Stamp Advisory Committee chose artwork featuring our global climate model to appear on a stamp. Here we provide some information about what went into making this image, from the perspective of climate science researchers.
- What is a global climate model?
- How the stamp’s artwork was created
- An image more than four decades in the making
- A short video recapping the artwork creation process
What is a global climate model?
One can think of a global climate model as a kind of ‘virtual earth’ – a sophisticated tool that allows scientists to perform experiments simulating the ways in which heat, moisture, momentum and other physical quantities move though the global climate system over time. Depending on how a researcher designs an experiment, a global climate model can be used to simulate the past, the present, the future, or some more hypothetical set of circumstances. Regardless of the time period being considered, a climate model performs a huge number of calculations to simulate how the different grid cells interact with and respond to one another over time. The computational demands of state-of-the-art climate models require them to be run on leading-edge, high-performance computers.
A key goal of the climate modeling research conducted at NOAA-GFDL is to improve our ability to understand and predict variations and trends in the Earth’s environment over time periods of a single season to centuries. Information that, in turn, can be used to enhance society’s ability to plan and respond.
Additional background info is available from NOAA-GFDL’s Climate Model webpage.
How the stamp’s artwork was created
The artwork on the 2014 Forever® international rate stamp is based on an extremely small fraction of all the data generated by the NOAA-GFDL global climate model. Though this particular climate model has been used to simulate many centuries, this graphic is based on a snapshot from only one July day. (A related Science On a Sphere animation covers a four-year period of 1,460 daily frames.) Additionally, though the model spans the full three-dimensional atmosphere and the global ocean to depths of more than three miles, the image focuses on ocean surface temperatures. Still, about a million individual model-simulated SST values were used to make the colorful image. ![[GFDL CM2.5 SST snapshot - no land - small]](/wp-content/uploads/pix/user_images/kd/Forever_Intl_2014/NOAA_GFDL_CM2p5_SST_noland.png)
To cover the whole globe at the level of the ocean surface, this NOAA-GFDL climate model employs a grid consisting of 1,540,800 grid cells. The center of each grid cell is less than 16 miles from the center of its nearest neighbors. As a first step of creating the four-year animation, 1,460 sets of 1,540,800 numbers representing sea surface temperatures were converted into rectangular maps covering the whole planet – one map for each day. The vivid SST images were generated at NOAA-GFDL in New Jersey using a visualization and analysis program named Ferret, a software package developed at another NOAA Research laboratory (NOAA’s Pacific Marine Environmental Laboratory or NOAA-PMEL) in Seattle, Washington.
Land areas were left black in those first images simply because there are no sea surface temperatures over land. [You may click on the rectangular maps on this web page to view larger versions.]
![[GFDL CM2.5 SST with NASA land - small]](/wp-content/uploads/pix/user_images/kd/Forever_Intl_2014/NOAA_GFDL_CM2p5_SST_snapshot.png)
As a second image processing step, one of the ‘Blue Marble’ maps made available by NASA’s Visible Earth project was merged with the SST images at NOAA-GFDL, thereby providing a visually interesting depiction of land areas.
Next, the collection of 1,460 animation frames was transferred from NOAA-GFDL to yet another NOAA Research laboratory (the Earth System Research Laboratory or NOAA-ESRL, located in Boulder, Colorado). At NOAA-ESRL, the Science On a Sphere® (SOS) team performed additional processing of the rectangular images. One processing path allows the series of rectangular animation frames to be divided into four segments and projected seamlessly onto a 68 inch diameter carbon fiber sphere.
For more information about the SOS technology, which is installed in over 100 museums, science centers, and university locations, one may refer to the Science On a Sphere® home page and an SOS exhibit floor plan.
A subsequent image processing stream pursued at NOAA-ESRL generated an animation of the NOAA-GFDL CM2.5 sea surface temperatures that one can view on a computer or other flat screen, including the YouTube version shown above.
Converting from the original rectangular maps to forms that either can be projected onto a three-dimensional sphere or appear to be draped on a globe when presented as a two-dimensional image, involves a good deal of geometry. Members of the US Postal Service design team worked with Science On a
Sphere staff to arrive at the final version of the image – one representing a single July day – that served as the basis for the US Postal Service’s 2014 Forever® international rate stamp shown at the top of this page.
An image more than four decades in the making
The NOAA-GFDL global climate model responsible for the stamp’s image is a direct descendant of the world’s first coupled atmosphere-ocean general circulation model (GCM) used to study climate. That first-ever global coupled climate model was created right here at NOAA-GFDL in Princeton, N.J., by Syukuro Manabe and Kirk Bryan, who published their initial results in 1969. About 40 years later, in the same building, the NOAA-GFDL global model whose results are depicted on the stamp was developed by a team of researchers, many of whom had worked with Manabe and Bryan over the years. Results from the NOAA-GFDL CM2.5 model were first published in the scientific literature in 2012.
![[Manabe and Bryan 1960s]](/wp-content/uploads/pix/user_images/kd/Forever_Intl_2014/ManabeAndBryanPhoto.PNG)
The global climate model used to produce the image is far more sophisticated than Manabe and Bryan’s first GCM. Major advances in climate modeling over the intervening 40 years stem from two main sources. For one, within the scientific community, we have increased our knowledge about the way our planet’s climate system works and how the different components interact and respond to one another. That knowledge has been converted into the equations and computer code that comprise today’s climate models. Secondly, computers have become much more powerful, allowing researchers to divide the globe into ever smaller grid boxes (higher spatial resolution) which results in a more detailed and more physically realistic simulation of processes taking place in the three-dimensional atmosphere, ocean and land. It is not uncommon for people to note that today’s smartphones have more compute power than the big mainframe computer Manabe and Bryan used in the late 1960s.
The creation of the world’s first GCM was a noteworthy accomplishment. In 2006, an article titled Milestones in Scientific Computing appeared in the journal Nature. The article cited the original climate model of Manabe and Bryan as among the breakthroughs that have had a profound effect on our lives. Others cited included the first medical CT scanner, the first hand-held scientific calculator, and the Internet.
And now, artwork derived from a modern descendent of that first NOAA-GFDL coupled climate model will circle the globe in the form of the US Postal Service’s 2014 Forever® international rate stamp.
A short video recapping the artwork creation process
(47 seconds)
Related link
- US Postal Service unveils new Earth Day stamp celebrating NOAA Climate Science: NOAA Research’s webpage describing the stamp and its first day of issue ceremony in Washington, DC on Earth Day 2014