

Simulations of Underwater Plumes of Dissolved Oil in the Gulf of Mexico
Alistair Adcroft12, Robert Hallberg1, John P. Dunne1, Bonita L. Samuels1, J.A. Galt3, Christopher H. Barker3 and Debra Payton3 (2010), Simulations of underwater plumes of dissolved oil in the Gulf of Mexico, Geophys. Res. Lett., doi:10.1029/2010GL044689, in press. [pdf]
Summary
A simple model of the temperature-dependent biological decay of dissolved oil is embedded in an ocean climate model and used to simulate underwater plumes of dissolved and suspended oil originating from a point source in the northern Gulf of Mexico, with an upper-bound supply rate estimated from the contemporary analysis of the Deepwater Horizon blowout. The behavior of plumes at different depths is found to be determined by the combination of sheared current strength and the vertical profile of decay rate. For all plume scenarios, toxic levels of dissolved oil remain confined to the northern Gulf of Mexico, and abate within weeks after the spill stops. An estimate of oxygen consumption due to microbial oxidation of hydrocarbons suggests that a deep plume of hydrocarbons could lead to localized regions of prolonged hypoxia near the source, but only when oxidation of methane is included. [Abstract from GRL paper]
What We Are [and are not] Modeling
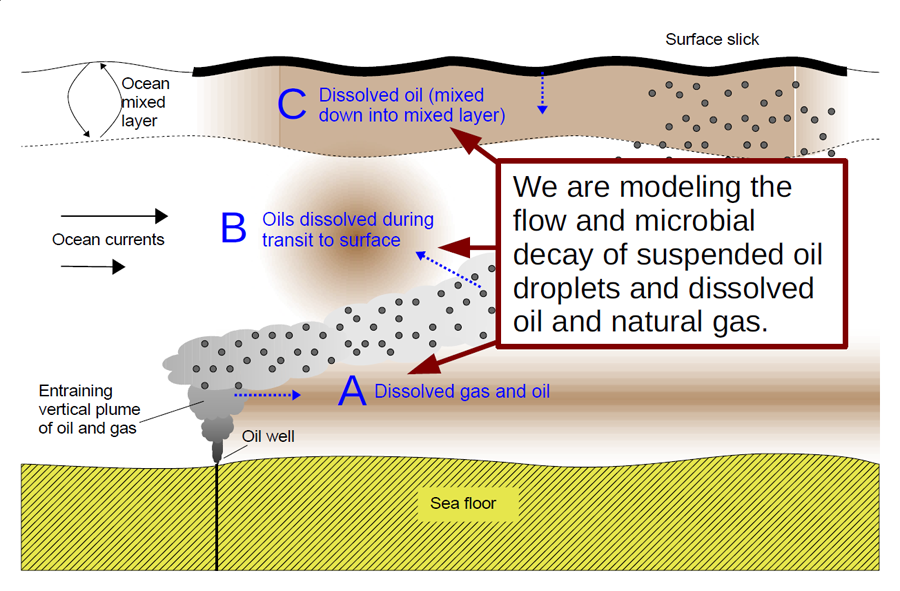
Oil from a deep spill takes the form of droplets of various sizes. The large droplets rise to the surface and ultimately coalesce to form the surface slick. Very small droplets (less than 100 micron diameter, about the width of a human hair) rise so slowly that they are effectively suspended in the water. Applying dispersant acts to break up the large droplets into smaller droplets. Additionally, some of the compounds in crude oil (and natural gas) are soluble in water, and actually dissolve out of both the large and small droplets. The dissolved compounds are not visible, unlike a slick, and the suspended droplets are typically at such small concentrations that the water can appear clear. This study focused on the fate and effects of these dissolved compounds and suspended droplets.
We examined the evolution of plumes of hydrocarbons that arise from the dissolution of oil and gas and/or suspension of small oil droplets in the water column, associated with a deep water oil leak.
We did not model the surface slicks, tar balls or the oil in transit to the surface.
The microbial decay is an idealized function of temperature, which was fitted to laboratory and in-situ data from other studies. At 25°C (77°F), typical of the surface waters in the Gulf, the exponential decay time scale is 7 days (i.e. a half-life of about 5 days). At 5°C (41°F), typical of the temperatures at 1km depth, the exponential decay time scale is 62 days (or a half-life of 43 days).
Animations
In the paper, we considered the consequences of injecting a fixed flow of oil for nineteen weeks at various depths. The animations shown here differ from the paper, in that they have been remade assuming a fixed flow for only twelve weeks, consistent with the time line of the Deepwater Horizon spill.
Also in the paper, we used an oil flow rate into each plume of 10,000 barrels per day and a methane flow into only the deepest plume of 2,400 tons per day. At the time of writing these flow rates were thought to be reasonable estimates. The results of our simulations are easily rescaled for different flow rates as future research provides refined estimates of the oil and gas that actually went into each of these plumes.
In August, NOAA published a revised estimate of total flow rates that exceeded those we used in the paper. In these animations we still use 10,000 barrels of oil per day for the mixed-layer plume (near the surface) but for the deep plume (~1,100 m deep) we use 6,000 barrels per day of oil and 4,300 tons per day of methane.
Animation 1 (left) shows the simulated concentration (in parts per billion) of dissolved oil in the ocean mixed layer (near the sea surface). The simulated ocean currents used here are plausible but should not agree in detail with the observed currents. The source of oil is steady between April 20th and July 15th but the plume wavers back and forth with the changing ocean currents. The initial position of the loop current can affect the exact location of the dissolved oil plumes, but will not substantially alter the confinement of the significant concentrations to the Northern Gulf of Mexico, provided that the microbial oxidation is taken into account.
In contrast to the first animation, animation 2 (right) shows what happens if microbial decay is omitted (as in some previous studies); the strong surface currents can spread the plume of dissolved oil throughout the Gulf of Mexico and as far as the Florida Straits and beyond. This extensive spreading of dissolved oil is not what has been observed and we do not believe that this animation is representative of actual events.
Animation 3 (left) shows the percentage draw down of dissolved oxygen for a 300 m thick deep plume (as a percentage of climatological levels at 1,000-1,300 m depth). The regions of significant oxygen depletion remain confined to the source region. If the actual plume were much thicker, both the hydrocarbon concentration and oxygen draw down would be proportionately smaller due to dilution.
Sensitivity of Results
All of these results depend both on the overall amount of oil and methane released, and on where it ends up in the water column. However, the timing and distribution of potentially toxic concentrations of dissolved oil in the mixed layer are not particularly sensitive to these assumptions.
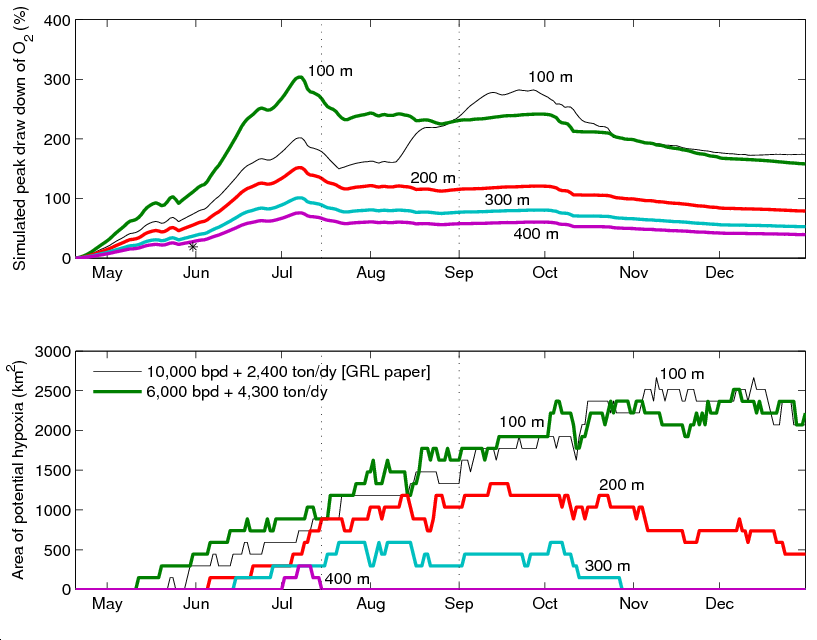
The magnitude of the oxygen draw-down in the deep (~1,100 m deep) plume, and area of significant oxygen depletion, depend strongly on the thickness of that plume, as shown at left. The light blue line corresponds to animation 3, above, with a 300 m thick plume. The other colored lines use different plume thicknesses and also have a shut-off date of July 15th (in the GRL paper, the shut-off date was September 1st which is shown here as a thin gray line). Observed profiles of anomalous dissolved organic matter (which are probably hydrocarbons) and oxygen depletion included by the Joint Analysis Group Report #2 show evidence of the oil in the depth range between 1,000 m and 1,300 m, but with individual features that are about 100 m thick. Continued observational monitoring will be needed to determine the actual thickness of the deep plume of dissolved oil, dissolved methane and suspended droplets of oil.
Changing the decay rate for the oil will affect the extension of the dissolved oil plumes and the timing of oxygen draw-down, but any rate that is broadly consistent with the laboratory studies of the decay of oil in seawater will give broadly similar results. It is only when the dissolved oxygen is fully consumed that the decay rates will be dramatically slower.
Affiliations: 1 – NOAA/GFDL, 2 – Princeton University/AOS, 3 – NOAA/ORR