

Modeled Impact of Anthropogenic Warming on the Frequency of Intense Atlantic Hurricanes
Morris A. Bender, Thomas R. Knutson, Robert E. Tuleya, Joseph J. Sirutis, Gabriel A. Vecchi, Stephen T. Garner, Isaac M. Held. Science, 22 January 2010: Vol. 327. no. 5964, pp. 454 – 458 DOI: 10.1126/science.1180568 (full text). For the abstract only, click here.
This work forms part of a continuing series of modeling studies at GFDL on the links between Atlantic hurricanes and climate variability and change.
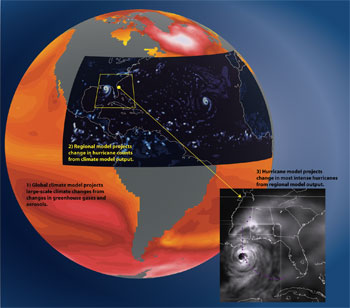
Click here for a larger version of this image
Earlier papers in this series (Knutson et al 2008; Zhao et al 2009) have suggested that the overall frequency of Atlantic hurricanes will not increase dramatically as the climate warms, and that, in fact, a decrease is more likely than an increase. In particular, these papers argue that the strong positive trend over the past 30 years in the overall frequency of Atlantic hurricanes should not simply be extrapolated into the future.
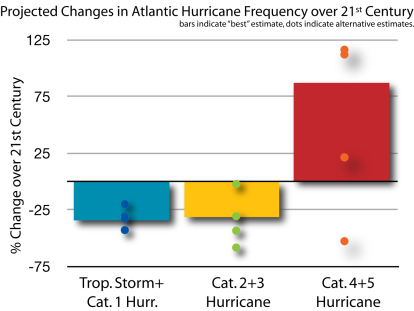
This paper asks how the frequency of the most intense Atlantic hurricanes will change in in the current century due to human-caused climate change. It suggests that we should expect an increase in the frequency of the strongest hurricanes in the Atlantic, roughly by a factor of two by the end of the century, despite a decrease in overall number of hurricanes, but we should not expect this trend to be clearly detectable until we near the end of the century, given a scenario in which CO2 doubles by 2100.
Click here for further information on global warming and hurricanes. For other work at GFDL on hurricanes, see our Hurricane Portal.
Answers to Frequently Asked Questions About this Study:
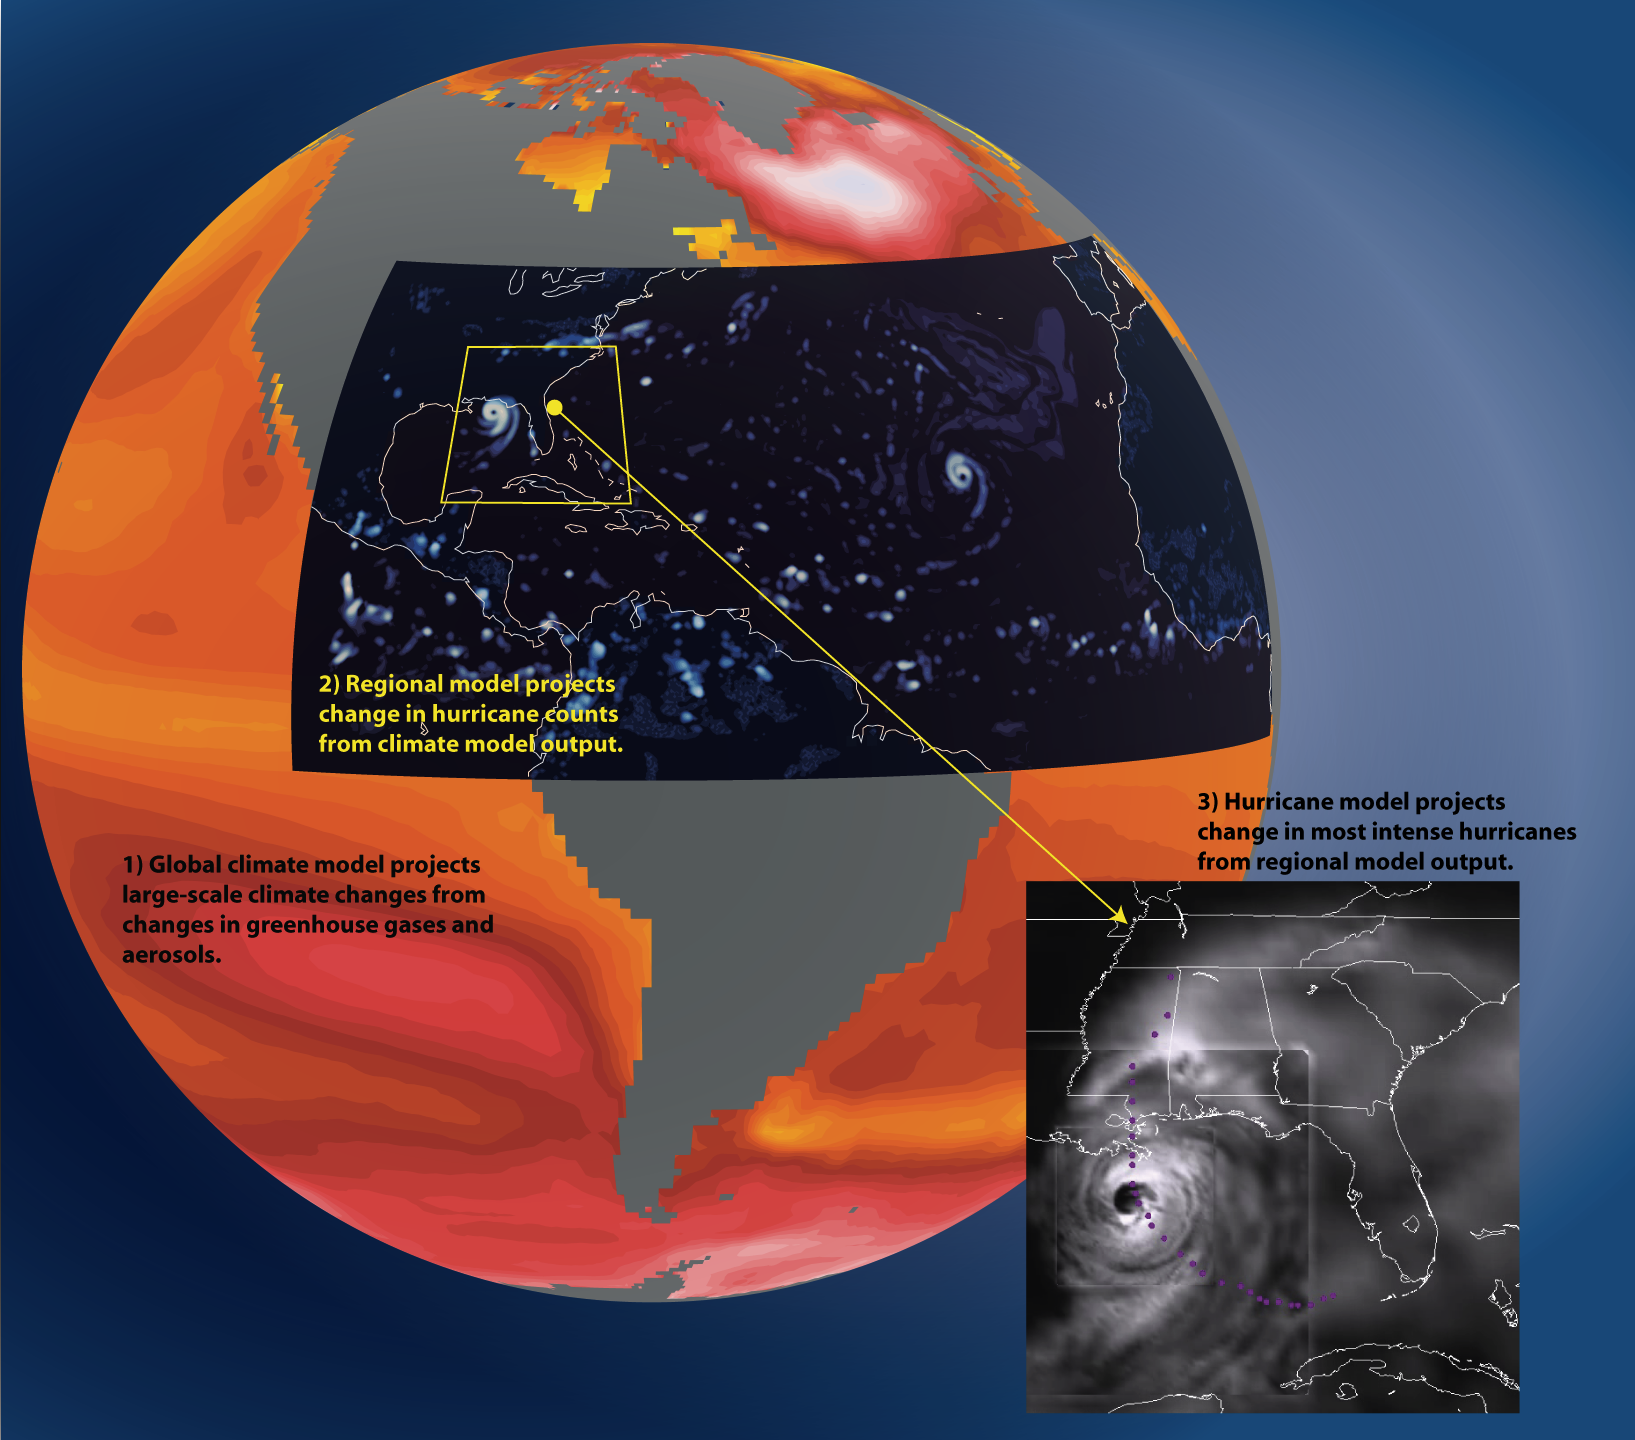
You say that the trend in intense hurricanes will not be detectable until the latter part of the century, but hasn’t there already been an increase in the number of intense tropical storms?
Click here for a larger version of this image
A large increase in the number of category 4 and 5 hurricanes has been observed in the Atlantic since 1980. But we expect the signal forced by greenhouse gases to be a long-term trend, and this period is too short to be able to distinguish a long-term trend from the multi-decadal fluctuations that are known to exist in the Atlantic. If we push back further in time, to minimize the contribution from internal variability, the raw data still indicates an increasing trend (for example, the observed trend since the 1940’s in category 4 and 5 hurricanes suggests a doubling over this time period). However, we believe that the reliability of the basin-wide category 4 and 5 counts decreases as one goes back in time, particularly prior to the satellite era. Our view is that potential data problems need to be addressed before one can have much confidence in quantitative trends on time scales long enough to isolate the greenhouse-gas induced trend. In the absence of the clear detection of a trend, we cannot use the observations of recent decades to either confirm or refute the trends projected by our model.
You estimate that the damage due to storms will increase in the future. How can you estimate “damage” with your meteorological models?
We cannot estimate damage directly. We use a published estimate of the fraction of damage in the US from hurricanes of different categories of intensity and then use estimates of the changes in the frequency of storms in these different categories to roughly estimate changes in damage. This estimate ignores changes in damage due to coastal development or possible effects of increasing sea level — it’s simply an estimate of damage due to changes in meteorology, holding everything else fixed. Even with these caveats, this conversion of storm numbers into damage estimates is very uncertain. Hopefully, we have provided enough information in the paper so that others, with different methodologies for estimating damage due to storms, can work with our hurricane projections to reach their own conclusions. Because there is compensation in our projections between a reduction in the total number of hurricanes and an increase in the most intense hurricanes, the estimated aggregate damage from all storms is sensitive to how one assumes storm damage varies with intensity.
But damage is due to landfalling storms. In the paper you just talk about the changes in the frequency of intense storms over the entire Atlantic basin!
That’s correct. We assume that the storms making landfall are representative of the storms throughout the Atlantic basin. We are not confident that our model can distinguish between the statistics of landfalling storms and the basin-wide statistics of Atlantic storms.
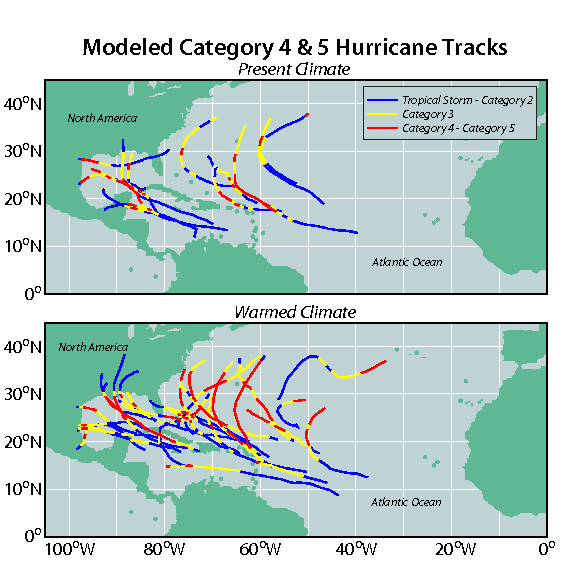
Isn’t it conventional wisdom that hurricanes will get stronger in a warmer climate?
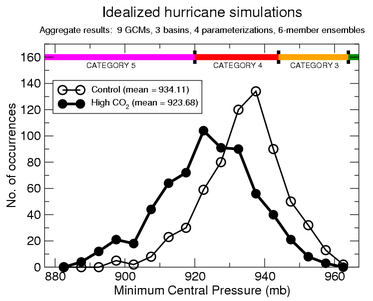
There are several lines of evidence, primarily based on theories for the maximum intensity that hurricanes can attain, and on numerical models of storm development in idealized conditions as summarized in this figure, that suggest that this “potential intensity” will increase on average as the climate warms.
However, these studies only consider the theoretical upper limit on the intensity of hurricanes, and do not address the important question of how many hurricanes will approach this upper limit. Previous modeling studies that have examined how the frequency of tropical cyclones might change could not simulate (or have not documented their ability to simulate) the intense systems that historically have caused most of the hurricane damage in the U.S.
The relationship between temperature and storm intensity is not as simple as “warmer oceans => stronger storms” since there are a variety of mechanisms that are capable of limiting the numbers of very intense storms. An example is increases in wind shears which can prevent strengthening that might otherwise occur under favorable conditions for storm development. As part of the goal of directly simulating the atmosphere in computer models at GFDL, this paper describes what we believe to be a credible direct dynamical simulation of the effects of climate change on the frequency of intense hurricanes.
Your approach seems complicated, involving several models. Can you explain it in simple terms?
To simulate very intense hurricanes one needs high spatial resolution, which prevents us from addressing this question directly with our current global climate models. Instead we use a three-step process (see figure at top of page).. The first step provides the oceanic and large-scale atmospheric conditions expected in the future. The second step provides information of the frequency of tropical storm formation. The third step provides information on storm intensity. Here is some more detail on these 3 steps:
- We start with the projections for the future supplied by the global climate models heavily utilized by the IPCC in its 4th assessment . These typically have spatial resolution of about 200km, and are not thought of as providing much direct useful information on tropical cyclones. But they provide estimates of the changes in sea surface temperatures and the large-scale flow over the Atlantic expected in the 21st century that will directly impact hurricane formation and intensity. (e.g. Vecchi and Soden 2007). We examine the consequences for hurricanes of the change in ocean temperatures and large-scale flow obtained by averaging over a large ensemble of 18 global models, and we also examine the implications of the changes projected by 4 individual models.
- We then feed this information into a regional model of the atmosphere over the North Atlantic, which we refer to as the ZETAC model, with resolution of about 18 km. This model’s impressive ability to simulate the year-to-year variations in the number of Atlantic hurricanes, including the recent upward trend in the Atlantic, as well as its projections for hurricane frequency in the 21st century, have been documented in a series of recent papers (Knutson et al I and II, and Garner et al). But this model does not produce any storms of category 3, 4 or 5 intensity. For more details on this step, see this FAQ sheet for Knutson et al I.
- We therefore take the next step, distinctive to this paper, of feeding the storms generated by this regional model into the GFDL Hurricane Model. Versions of this model have been utilized for nearly 15 years by both the US Weather Service’s National Center for Environmental Prediction and by the Navy for providing operational predictions of the track and intensity of tropical cyclones. If you monitor discussion forums during hurricane season you will probably recognize the GFDL model as one of the key tools relied upon for these predictions. Among other features, this model has 2 nested movable meshes that follow the storm, and includes coupling to the underlying ocean.
Why do you think that the GFDL Hurricane Model is adequate for predictions of intensity?

Click here for a larger version of this image
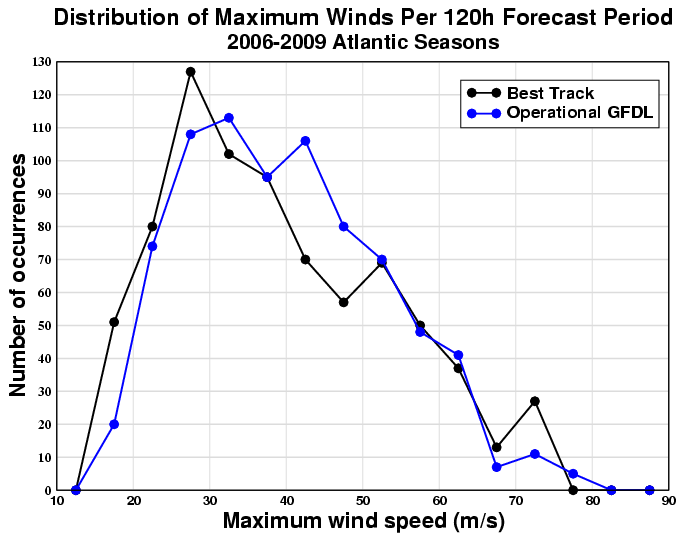
It is important for this work that the GFDL hurricane model is capable of generating category 4 and 5 storms. But more importantly, when one examines a large set of the model’s operational forecasts of storm intensity over the past several hurricane seasons, one finds that the distribution of intensities (which fraction of the storms become category 2, or 3, or 4) is reasonably accurate (see Fig. 1 in the paper). In addition, in this study, the downscaling step with the GFDL hurricane model results in a major improvement in the intensity distribution compared with that generated by the regional model. There is a remaining under-prediction in the frequency of the very strongest, category 5, hurricanes.
But doesn’t this model, like all others, have difficulty in predicting the intensity of individual storms?
Yes. But keep in mind that intensity prediction for individual storms involves not just the quality of the model but also the quality of the observations used as input into the model. One also has to deal with the possibility that storm intensity may be inherently very hard to predict in some cases due to atmospheric chaos. NOAA currently has a large effort to improve operational predictions of intensity.
It is essential to keep in mind the distinction between “weather” and “climate” Predicting the change in the statistical properties of storms (the “climate”), is very different from (and often easier than) predicting the future intensity of an individual storm (the “weather”). This distinction can be compared to the difference between predicting how a baseball player will perform in an individual at bat (“weather”), and in predicting how steroid use influences seasonal batting statistics (“climate”).
If your model underestimates by ~50% the number of category 4-5 storms for the present climate, why do you put credence in its projection of category 4-5 storms for a future warmer climate?
It is true that we underestimate the number of category 4-5 storms, and this is probably the most serious limitation of our modeling system in the context of this paper. However, we not aware of any other dynamical modeling study to date that produces a more realistic simulation of category 4-5 frequency or the multidecadal variation of storm intensity. Our judgment is that the intensity distribution in our model is beginning to be realistic enough at the category 4+ level that we can start to take the frequency projections of these very intense storms seriously. We have chosen to present percent changes in category 4-5 storms rather than absolute changes in numbers–owing to this low bias in our control simulations. It is our judgment that this is an appropriate way to attempt to account for this low bias at the present time. There may be a more elaborate statistical procedure to correct for this bias, but a more satisfying remedy awaits improvements in our models so that their simulated category 4-5 storm frequency is roughly equal to that in observations.
See also the related FAQ: “Could your model be underestimating the magnitude of the increase in intense storm activity in the future?”
Are there other approaches to this problem that provide similar, or different, predictions for the future?
Some high resolution global model simulations exist, perhaps most notably Bengstton et al, and Oouchi et al, that generate results qualitatively similar to those presented here. The Oouchi 20km model and the Bengsston “T213” model appear to have intensity distributions similar to our own recent efforts with a 50km global model (Zhao et al 2009) and unpublished work with a 25 km global model, which we do not judge as providing adequate direct simulations of intensity distributions without statistical corrections or further downscaling. The “T319” model utilized for a small number of integrations by Bengstton et al, may be superior in this regard, although explicit comparison of observed and modeled intensity distributions are not provided in that paper.
The downscaling work most relevant to our study is likely the model of Emanuel, et al., which is partly statistical and partly based on theoretical understanding of factors controlling hurricane intensity. We believe that there is broad consistency between the results of our two downscaling efforts, but a more detailed comparison between these very different methods has not yet been performed.
While hurricane projections that are based on statistical fits to historical data and those that combine physical reasoning and statistical procedures are clearly very important, the environments that storms will experience in the future will be sufficiently different from the environments experienced in the recent past that we feel that we need to reduce empiricism and get as close as we can to the fundamental fluid dynamics and thermodynamics in order to generate compelling projections. This is our goal in these modeling studies.
What are the major sources of uncertainty in these projections for the future?
There are uncertainties associated with the limitations of the models used in our downscaling steps, but our work suggests that even with perfect downscaling, large uncertainties would remain due to uncertainties in the global model projections. For example, we get an increase in intense hurricanes when we downscale several of the individual global models utilized by the IPCC, as well as when we downscale an ensemble mean of a large sample of these models. But when we downscale the HADCM3 model of the UK’s Meteorological Office, we obtain a decrease in the number of Atlantic storms in all categories of intensity. The warming of the tropical Atlantic, relative to the warming of the tropics as a whole, is smaller in this model than in most other models, and we believe that this is the key to understanding this result.
If your downscaling of the well-regarded HADCM3 model results in a reduction in the frequency of intense hurricanes, then why are you downplaying this result and focusing on the models that result in an increase in frequency?
We not only downscale using the climate changes simulated by 4 individual global models but also using the climate change averaged over a much larger ensemble of 18 global climate models. In a variety of studies it has been found that the ensemble mean of all of these models provides a better climate simulation than any one model in isolation. Consistently, we place greater weight on the downscaling of this ensemble mean than on the results for any individual model. The downscalings of the 4 individual models do provide some feeling for the range of possibilities, but we currently trust the ensemble mean climate change as providing our best estimate.
Could your model be underestimating the magnitude of the increase in intense storm activity in the future?
This is possible, but one can argue both ways. There are arguments that our model might be underestimating this increase, but there are arguments why the model might be overestimating it as well. We have no compelling evidence for the bias being of one sign or the other at the moment.
[The following is a very tentative discussion of this issue.]
Click here for a larger version of this image
Projections of an increase in intensity of tropical cyclones seem to emerge more clearly from models as the horizontal resolution of these models improves and, as a result, their capability of simulating strong storms improves. Combined with the fact that our model underestimates category 5 storm frequency, possibly due to inadequate resolution, this suggests that our increase in intense storms might become larger with finer horizontal resolution.
An argument pointing in the opposite direction starts from Fig. 1b in the paper, which indicates that over the past 25 years, active years in the North Atlantic have also been years in which the intensity distribution has shifted to stronger storms. The figure shows the difference between the late (relatively active) and early (relatively quiescent) halves of this period. We do not believe that this is a global warming effect — in fact, one gets a similar result if one composites El Niño and La Niña years, with the former having both fewer and less intense cyclones. But Fig. 1b also indicates that our model underestimates this intensity shift. Since our model projects a decrease in the total number of Atlantic hurricanes, if it underestimates the importance of those factors that tend to lower intensity and-frequency together, it may overestimate the intensity shift associated with future climate change.
In what future directions are you taking this research?
The simulation of tropical cyclone frequencies in our global atmospheric models is improving rapidly, to the point that we believe that we can omit the second, regional model, step in our downscaling strategy, and work with global models on the one hand, and the operational hurricane prediction system on the other. We still cannot avoid the final step in this process, as our global models, at least, do not yet have an adequate simulation of the distribution of intensities. The quality of the global model simulations of storm frequency is evident in the recent work of Zhao et al 2009
We are working on much finer resolution global models, as are other groups around the world, that we hope will be capable of realistic simulations of hurricane intensity as well as frequency, providing a more unified and direct approach to this problem.
We are also interested in distinguishing more clearly between the effects of greenhouse gases, aerosols and natural climate variations on hurricane frequency and intensity through the past century, and we will be exploring this issue in the future.
Correction Note (Feb. 16, 2010)
We have noticed an error in the Supporting Online Material of our paper, which we provide a correction for here. In the Supporting Online Material, on p. 2, we state:
“In the hurricane model experiments, the mean intensity change (using one maximum surface wind speed value per storm) was -1.2% for all tropical storms and +0.7% for storms reaching hurricane intensity.”
The correct values are +0.7% increase in average intensity for all tropical cyclones and a +6.1% increase of intensity considering only hurricanes.
The original numbers were generated by computing an average change in intensity in each year and then averaging over different years. This inappropriately weights storms in quiet years more than storms in active years. Since quiet years tend to have less intense storms, this biases the intensity change to low values. (It also creates ambiguities when there are years with no hurricanes.)
Correction Note (Dec. 15, 2010)
There are two minor errors in Table 1 of the paper, which we describe and correct below.
- The “Number of storms in control (average storms per year)” result for Category 4 and 5 storms should be 0.57, rather than 0.59 as listed in Table 1. (The values in Table S1 for category 4 (0.56) and category 5 (0.02) are correct as given, and add to 0.57 rather than 0.58 due to rounding effects.)
- The “Ensemble warmed climate (every year; percent change)” result for Category 4 and 5 storms should be 87%, rather than 81% as listed in Table 1. (The values in Table S1 for category 4 (+83%) and category 5 (+200%) are correct as given.)
The above minor errors were introduced into Table 1 due to an extra storm erroneously being included in the control category 4 number count.
Related Media
Model Outgoing Longwave Radiation (OLR).
 An animation of simulated clouds and weather systems generated for a three-month period (Aug-Oct 2005) using the GFDL Zetac regional atmospheric model. The brightest shading in the tropical parts of the domain corresponds to high clouds associated with storms and deep tropical convection. High-res PNG.
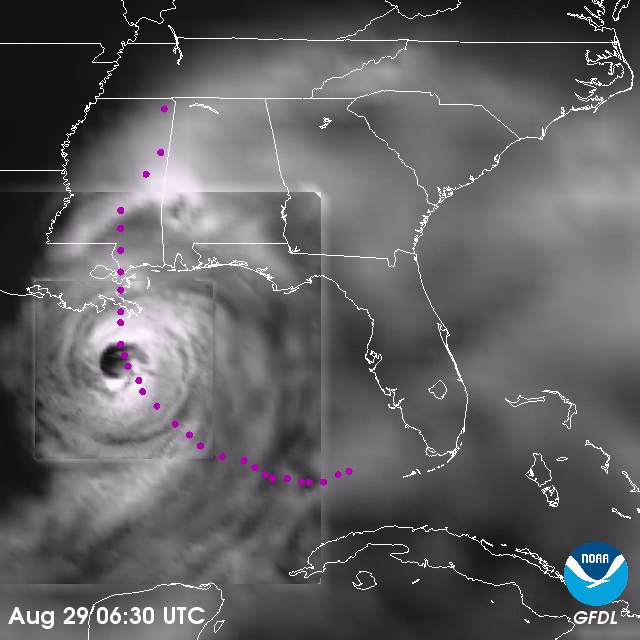
GFDL Operational Hurricane Model Relative Humidity Loopof Katrina.
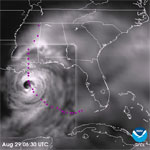 The three-nest structure of the GFDL Hurricane Model can be seen in this animation of vertically integrated relative humidity at half hour intervals between the model dates August 27-30, 2005. The magenta glyphs depict actual observed track positions. High-res PNG.
Science Podcast, January 22, 2010
Listen to the podcast interview with Morris Bender and Tom Knutson on the modeled impact of anthropogenic warming on the frequency of intense Atlantic hurricanes.