

FV3: Finite-Volume Cubed-Sphere Dynamical Core
Full Physics Cloud-permitting Simulation (3km resolution)
Hurricane Sandy (2012)
A 3-km globally-uniform 72-hour, real data forecast was made using the High Resolution Atmospheric Model (HIRAM). The physics package was from GFDL AM2, with a few exceptions: the stable PBL parameterization was turned off, a six-category microphysics scheme was included, and the new GFDL double-plume convective parameterization was used. The forecast began at 18 UTC on October 24, with Hurricane Sandy just south of Cuba and ends at 18 UTC October 27, with Sandy spinning just off the coast of the Southeastern U.S.
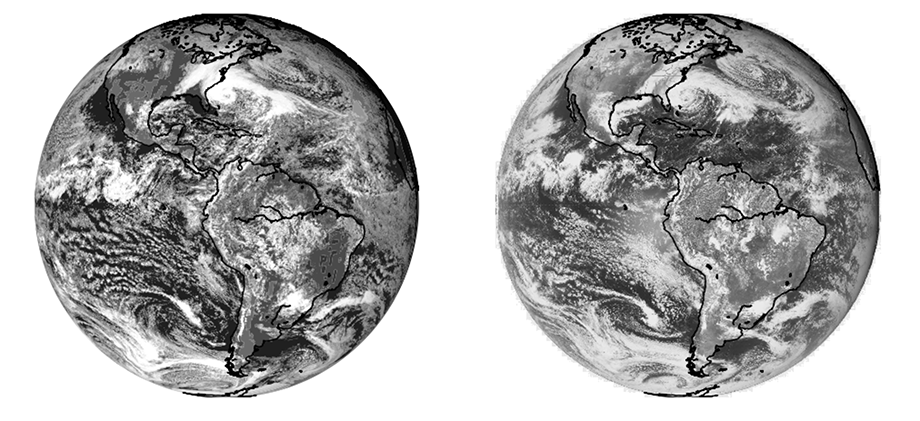
Figure 4: 72-hour forecast (top) compared to the GIBBS GOES full disk visible satellite imagery (bottom) at 18 UTC October 27, 2012
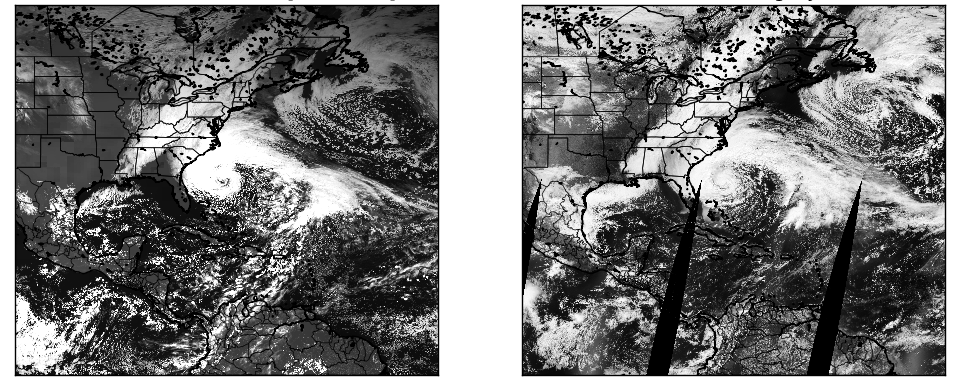
Figure 5: A closer view of the 72-hour forecast (left) compared to MODIS visible satellite imagery (right) at 18 UTC October 27, 2012.
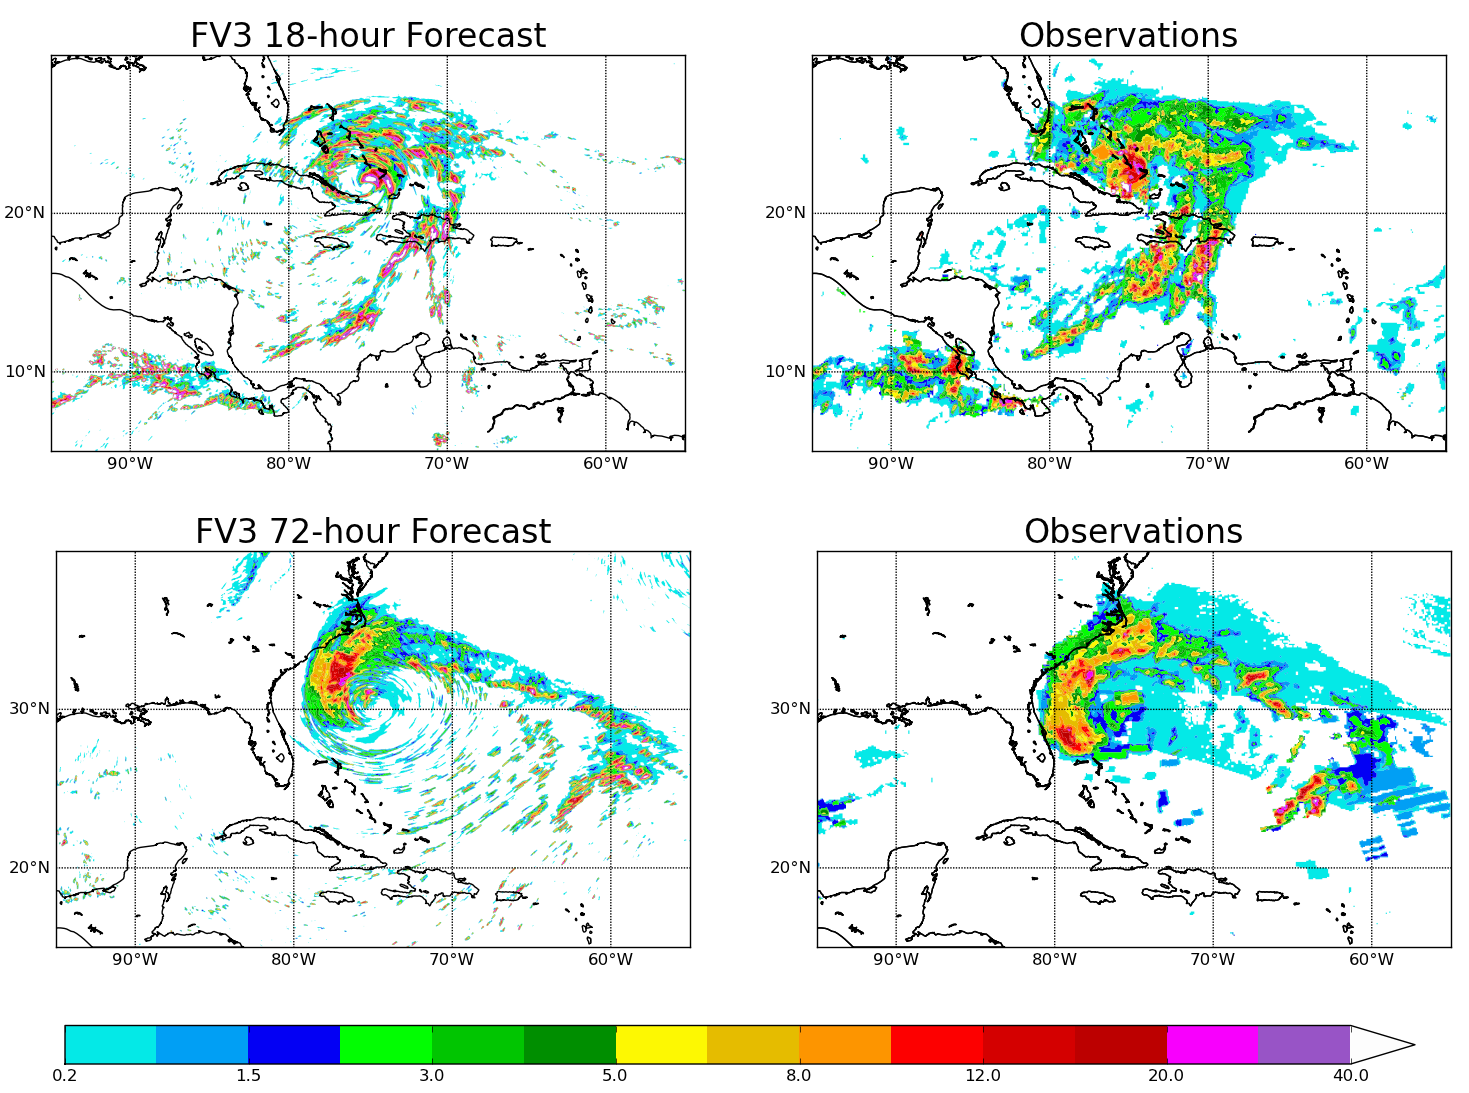
Figure 6: 1-hour accumulated precipitation in mm, at 12 UTC October 25, 2012 (top) and 18 UTC October 27, 2012 (bottom). Observations are from the CMORPH precipitation dataset.
Moore OK tornado event (2013)
Another 3-km globally-uniform 72-hour, real data forecast was made with HIRAM, starting at 0 UTC May 18, and using the previously mentioned physics package. During this three day period there were several severe convective outbreaks over the central U.S. and on the afternoon of May 20, the tornado that devastated Moore, OK was spawned along a line of convection that stretched from North Texas to Missouri.
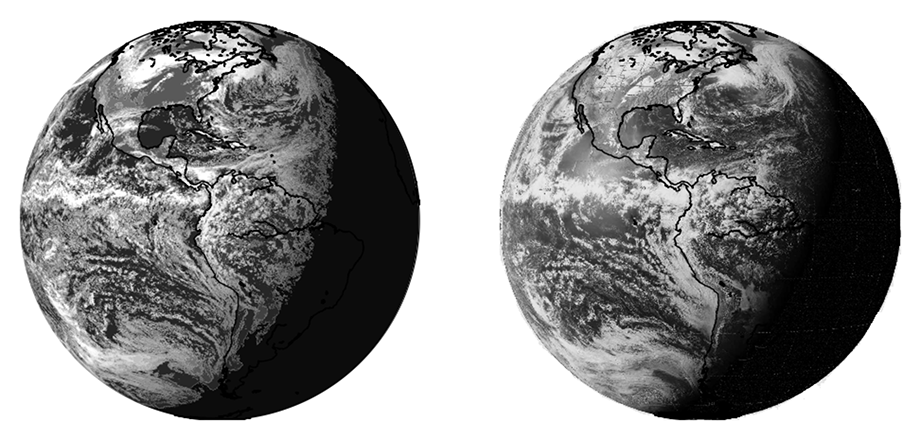
Figure 7: Same as Fig. 4, but at 21 UTC May 20, 2013 (69-hour forecast).
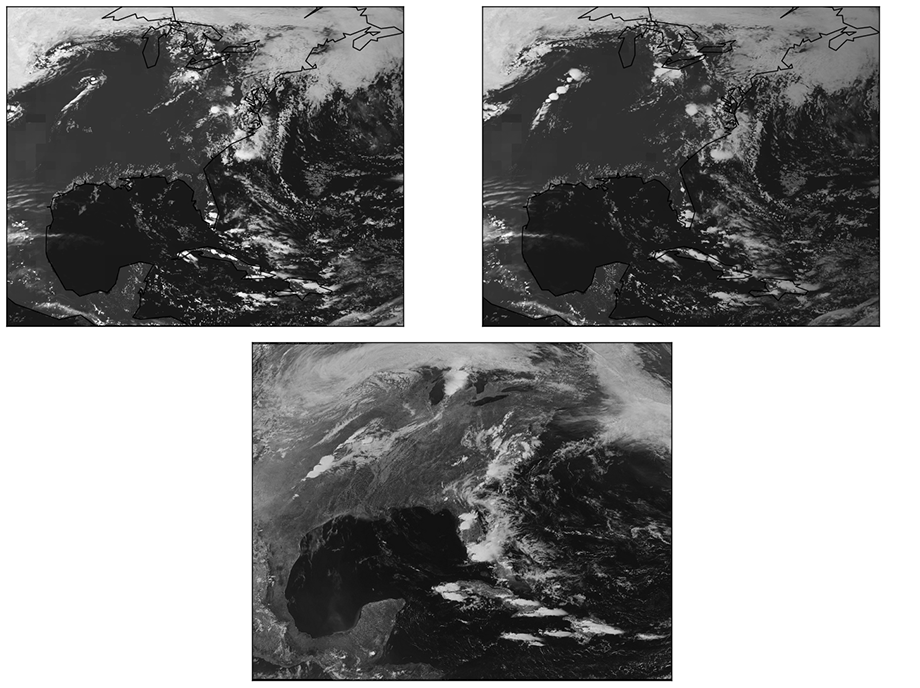
Figure 8: Top figures show forecast of the Moore, OK tornado event at 20 UTC (left), a 68-hour forecast and 21 UTC (right), a 69-hour forecast. The bottom figure shows the GOES-13 visible satellite imagery taken at 19:55 UTC. The forecast convection is delayed by about 1 hour and displaced slightly to the north and east.