

Featured Results
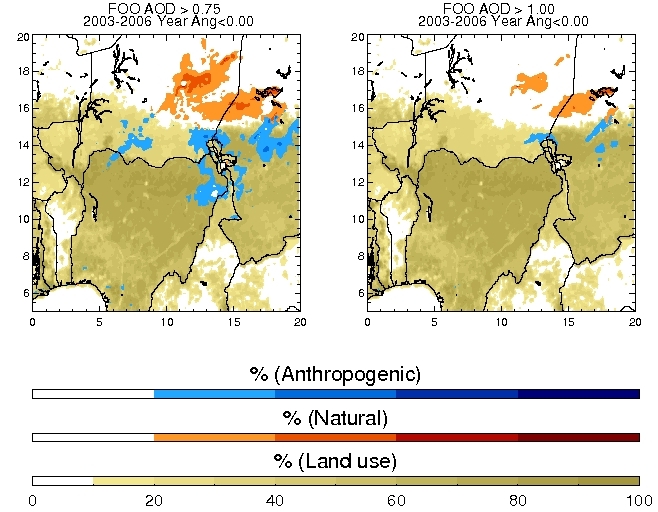
Figure. Distribution of natural (red shading) and anthropogenic (blue shading)
FOO with αthresh = 0 and (upper
left) Ï?thresh = 0.25, (upper right)
0.5, (lower left) 0.75, and (lower right) 1, overplotted on the
percentage land use (croplands and pastures) from 10% to 100% (in
yellow, the lighter the color the higher the percentage of land use).
The units of FOO are percentage of days satisfying the criteria by the
total number of days with nonmissing MODIS data per year, and averaged
from 2003 to 2006.
“Identification
of anthropogenic and natural dust sources using
Moderate Resolution Imaging Spectroradiometer (MODIS) Deep Blue level 2
data” by Paul Ginoux (NOAA GFDL), Dmitri Garbuzov (Princeton U) and Christina Hsu (NASA) explores a
new method to detect anthropogenic and natural dust sources from
satellite data in the eastern part of West Africa. The anthropogenic
contribution appears to be significant around the lake Chad, but the
magnitude of these sources seem weaker than the natural sources, in
particular relative to the Bodele depression.