AM4
AM4/LM4 (Zhao et al., 2018a,b) was developed from AM3 (Donner et al., 2011) and HiRAM (Zhao et al., 2009), and it contains:
- the hydrostatic version of the FV3 finite-volume cubed-sphere dynamical core, with minor modifications from the version used in AM3;
- a substantially updated version of the GFDL radiative transfer code, with refitting to line-by-line simulations using the latest spectroscopy and adding 10 um CO2 band among other changes; this increases the TOA radiative forcing due to quadrupling of CO2 by roughly 10%;
- an alternate topographic gravity wave drag formulation that handles the anisotropy of the subgrid topography naturally and treats the blocked versus wave components of the drag in a distinctive way (Garner 2005);
- a double-plume model representing shallow and deep convection, with stronger/weaker lateral mixing rate for the shallow/deep plume, with convective inhibition closure for the shallow plume mass flux (Bretherton et al., 2004) and cloud work function relaxation closure for the deep plume, and with the deep plume strongly constrained by the environmental relative humidity;
- a “light” chemistry mechanism using AM3’s chemistry as a starting point, retaining the ability to generate aerosol distributions from emissions, but with ozone and other oxidants prescribed;
- an aerosol module similar in structure to that in AM3, but with significant modification to wet removal by convection and by frozen precipitation;
- single-moment cloud microphysics as in AM3 but with substantial changes in the droplet simulation and strongly reduced aerosol indirect effect;
- an updated surface flux formulation over oceans based on COARE3.5 (Edson et al., 2013);
- cloud fraction prediction, boundary layer formulation, and non-orographic gravity wave scheme essentially as in AM3 and AM2, with minor retuning.
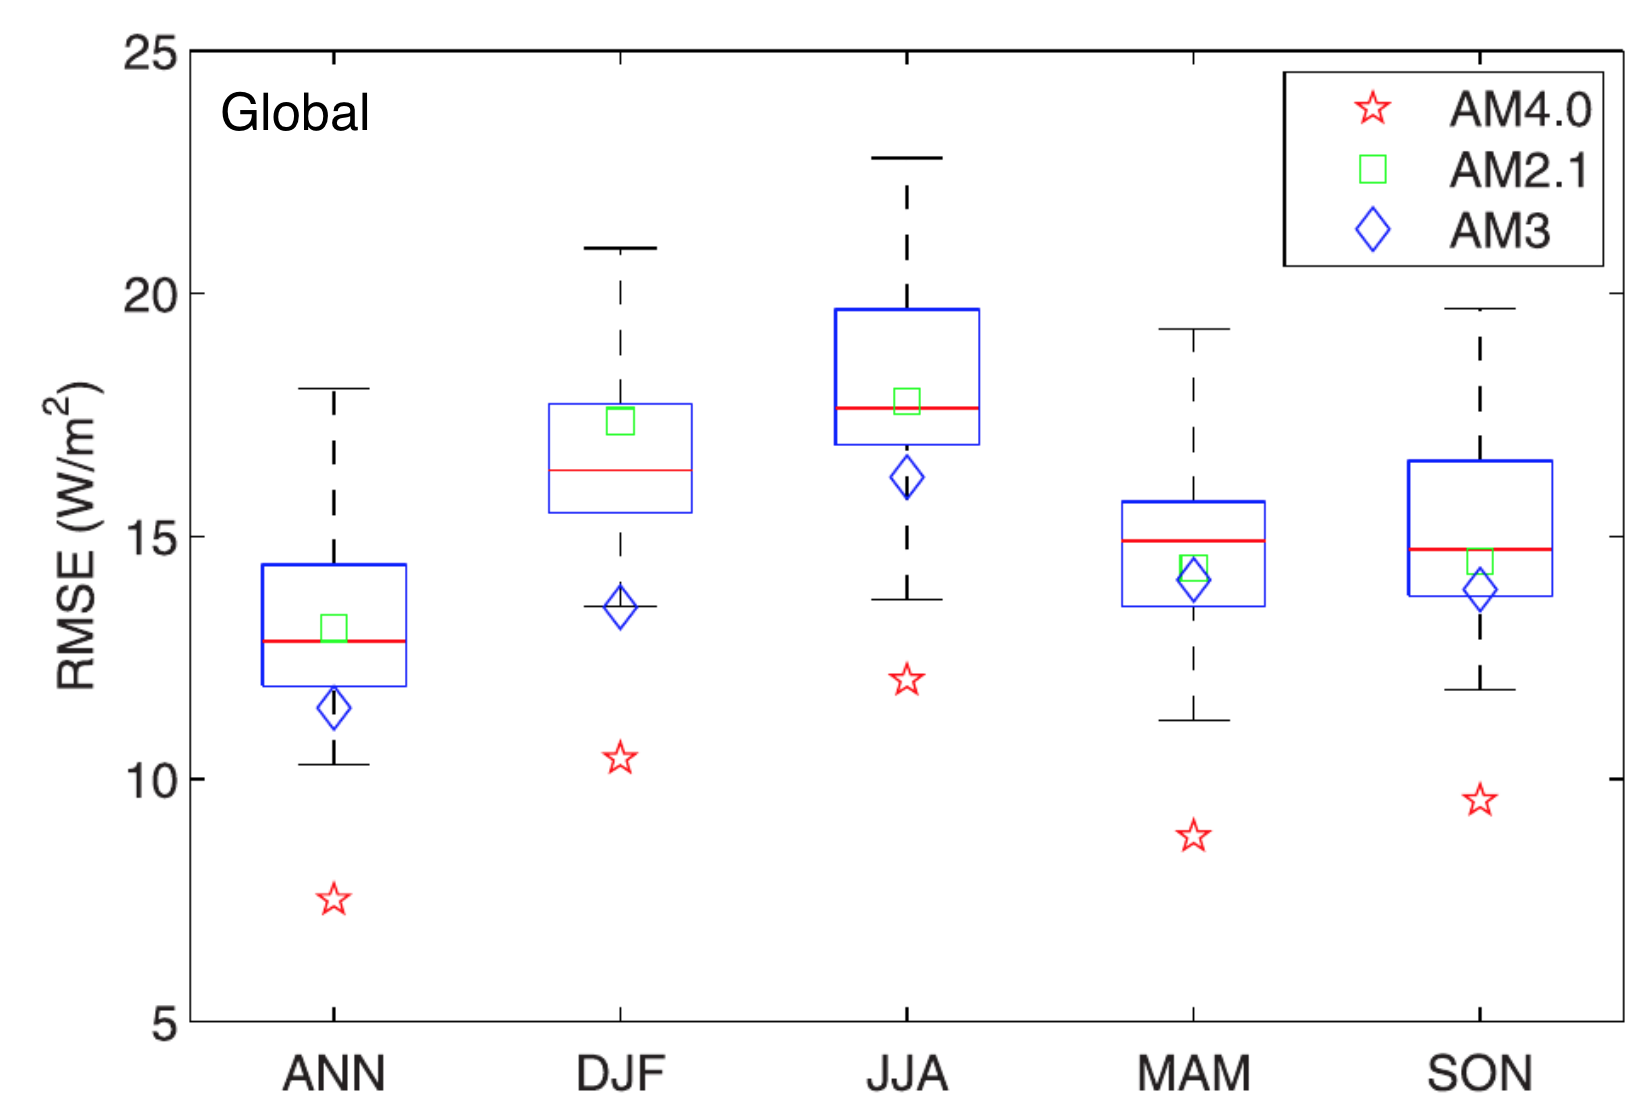
The simulation quality by AM4/LM4 in AMIP (Atmospheric Model Intercomparison Project) mode forced by the observed sea surface temperatures and sea-ice distribution is described in Zhao et al. (2018a). To give an example, Figure 1 shows a comparison of the RMS errors of AM4/LM4 simulated long-term climatological distribution of top-of-atmosphere net shortwave radiation with the CMIP5 model and the earlier GFDL models. The observational estimates are based on the Clouds and Earth’s Radiant Energy Systems Energy Balanced and Filled data, edition 2.8 (CERES-EBAF-ed2.8). The box plots show the results from the CMIP5 models with red lines indicate the median values and whiskers the maximum and minimum values from the CMIP5 ensemble. The RMS errors are computed for both the annual mean and individual seasons for the entire globe. The details in model formulations, sensitivities to physics parameterizations and forcing agents, and the tuning strategies are documented in Zhao et al. (2018b).