

El Niño Media
ENSO schematic
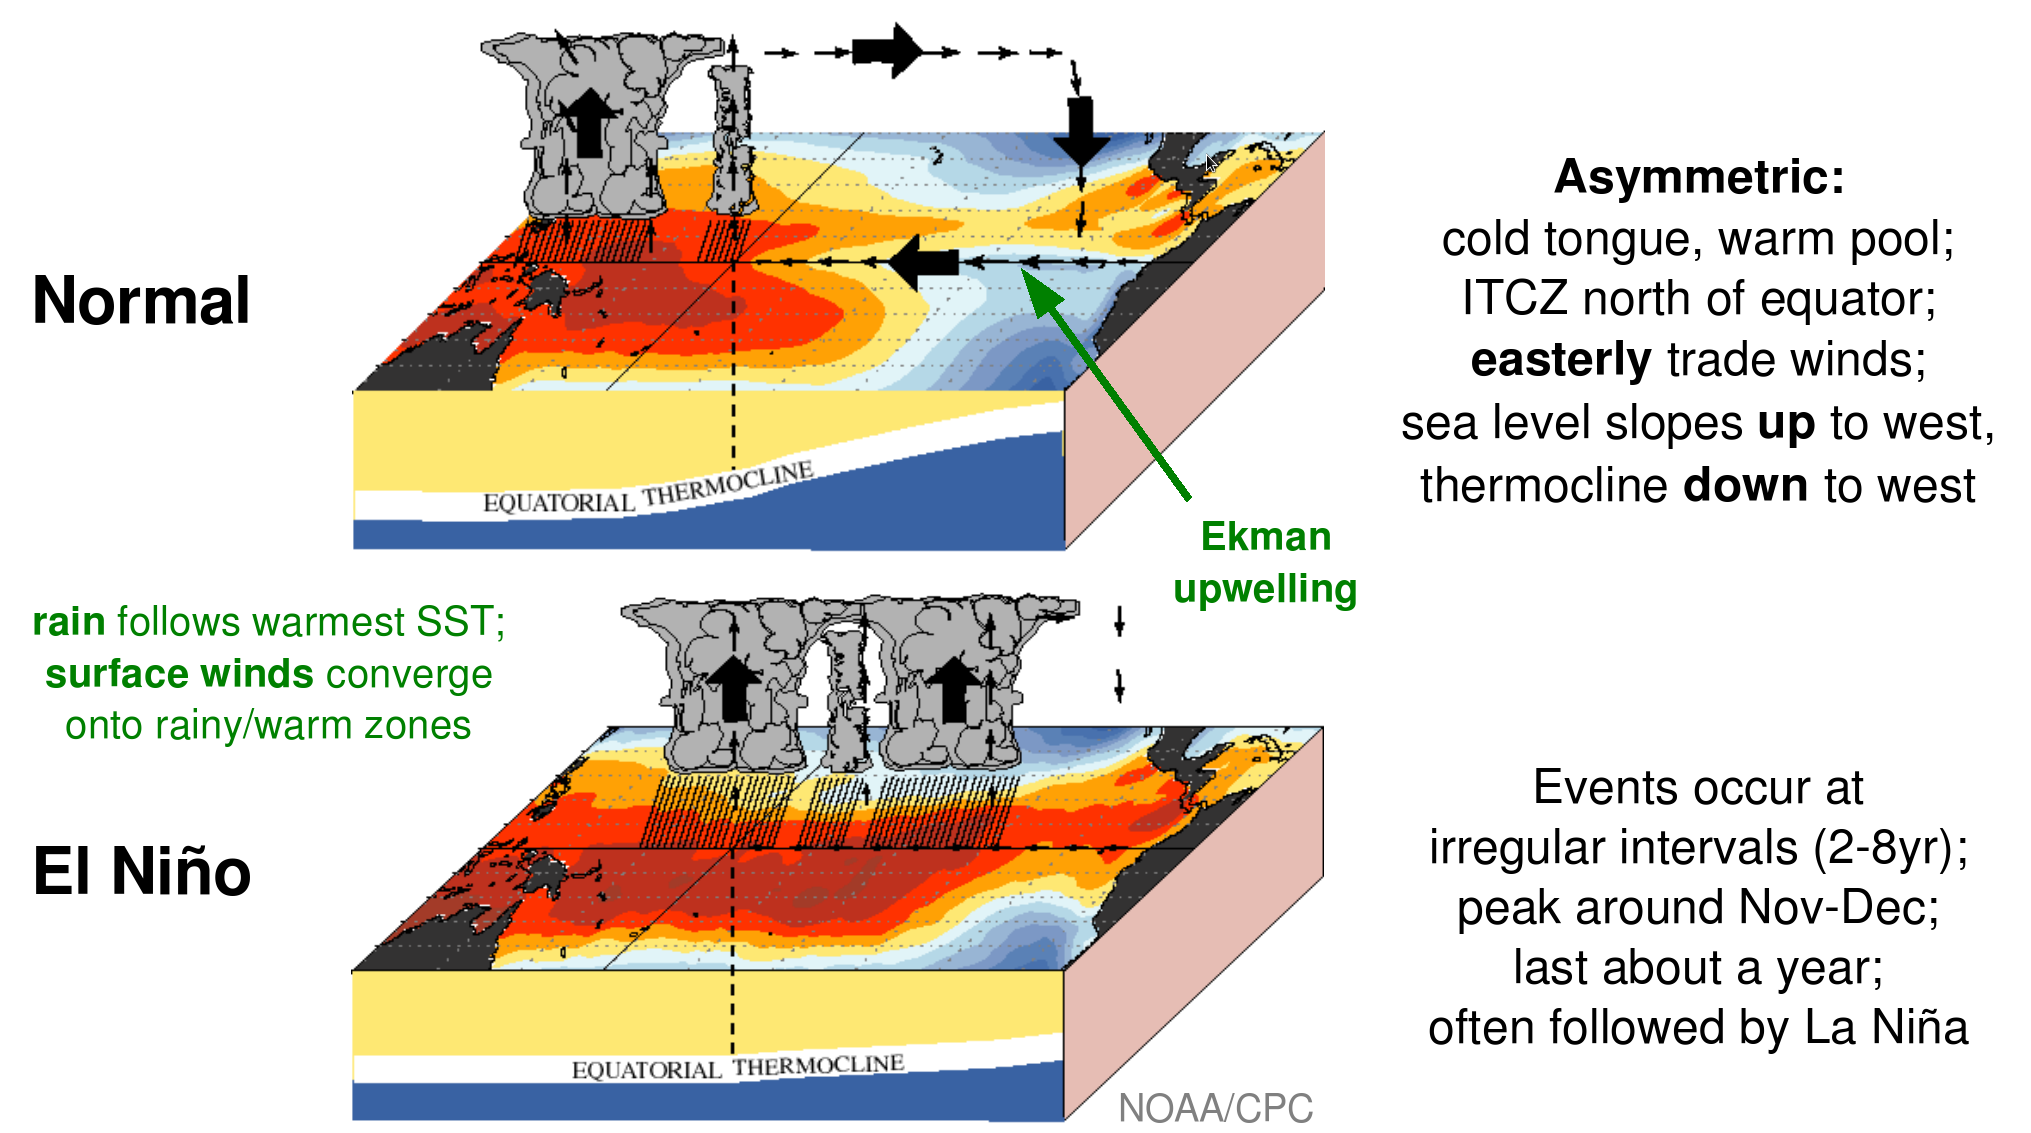
ENSO schematic: Comparison of (a) normal and (b) El Niño conditions, for the tropical Pacific region in boreal winter (Dec-Jan-Feb).
ENSO impacts
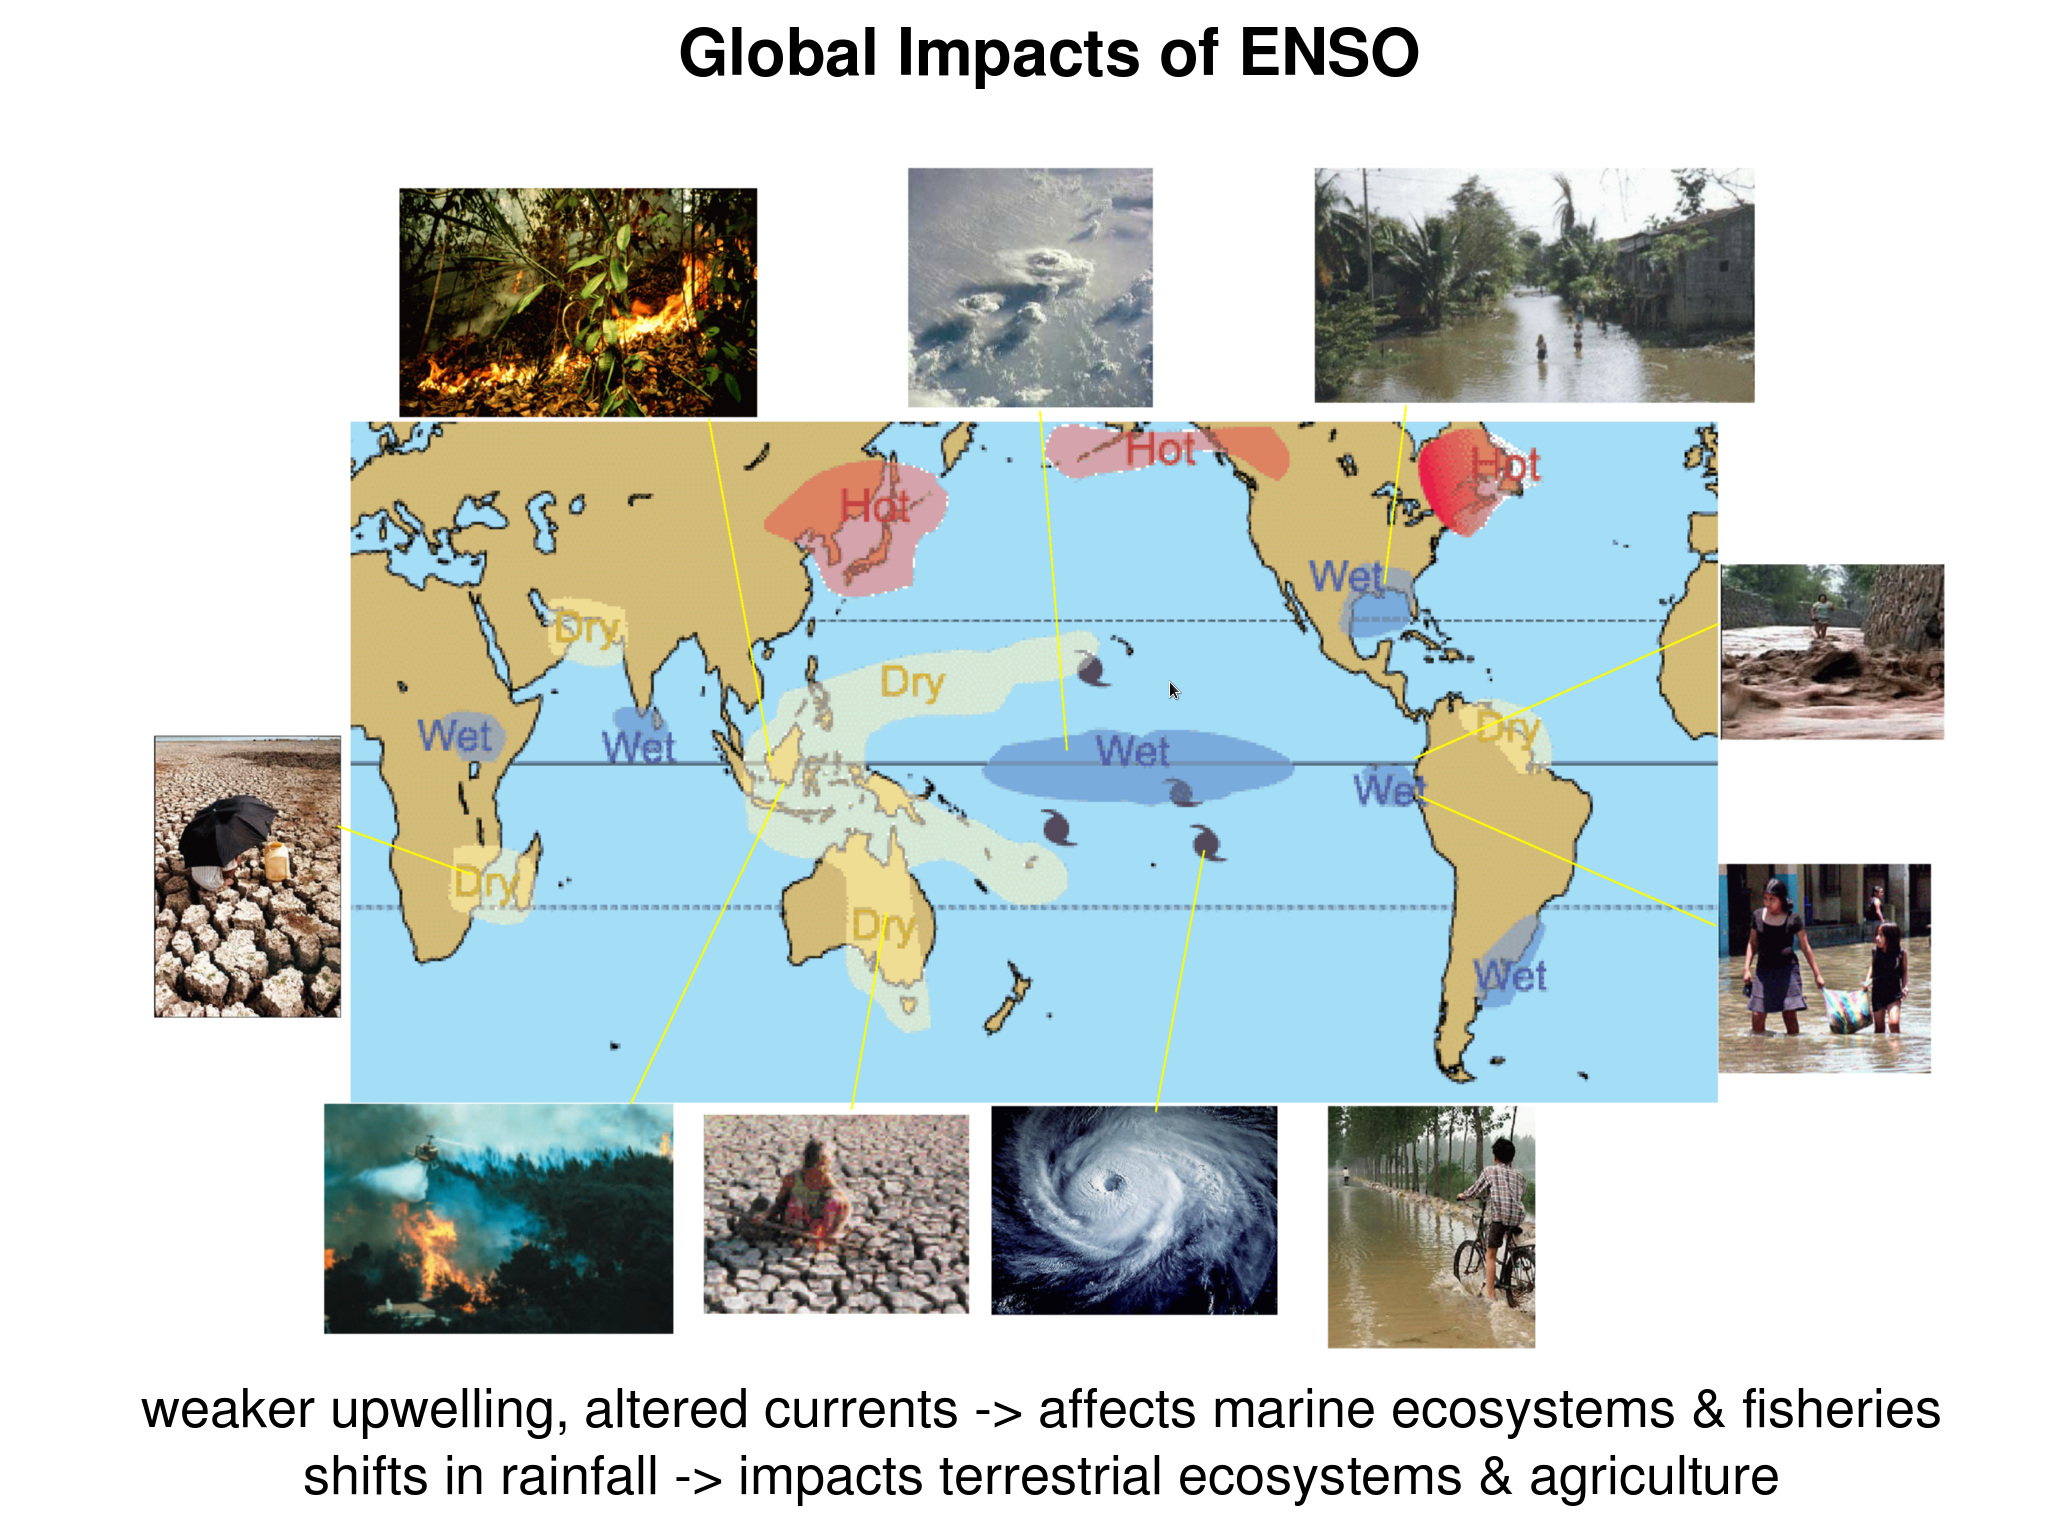
ENSO impacts: Global impacts of an El Niño event. ENSO affects fisheries, agriculture, weather, and natural disasters worldwide.
El Niño subsurface temperature anomalies

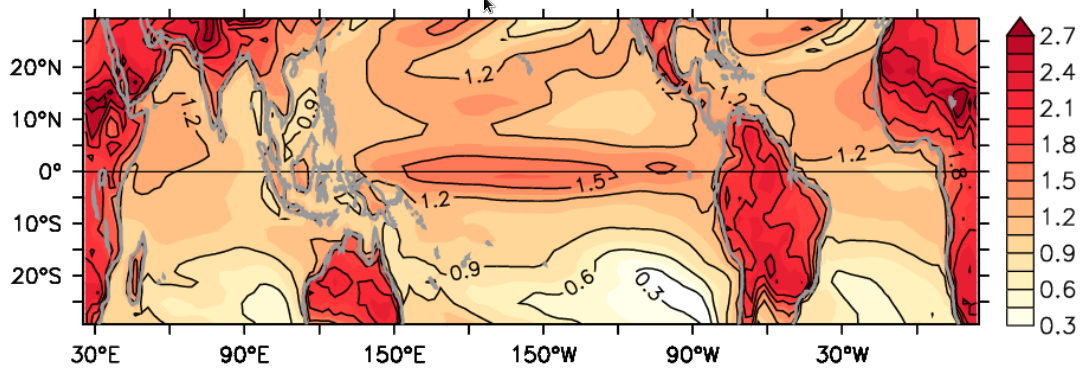
El Niño subsurface temperature anomalies: Temperatures within the top 270 meters (900 feet) of the IndoPacific ocean, for an El Niño event simulated by the CM2.1 global coupled GCM. Red areas indicate warm water –more than 1°C (1.8°F) above normal — and blue areas are cold. (Image from A. Wittenberg and H. Vahlenkamp, NOAA GFDL.)
ENSO improvements with increasing resolution

ENSO improvements with increasing resolution: As model resolution increases, the simulation of ENSO’s patterns of variability gradually become more realistic. Left column: standard deviation of SST anomalies. Right column: 200hPa geopotential height anomalies, regressed on NINO3 SST anomalies. (a) Observations; (b) CM2.1; (c) CM2.5-FLOR; (d) CM2.5; (e) CM2.6.
Instrumental and coral records of ENSO
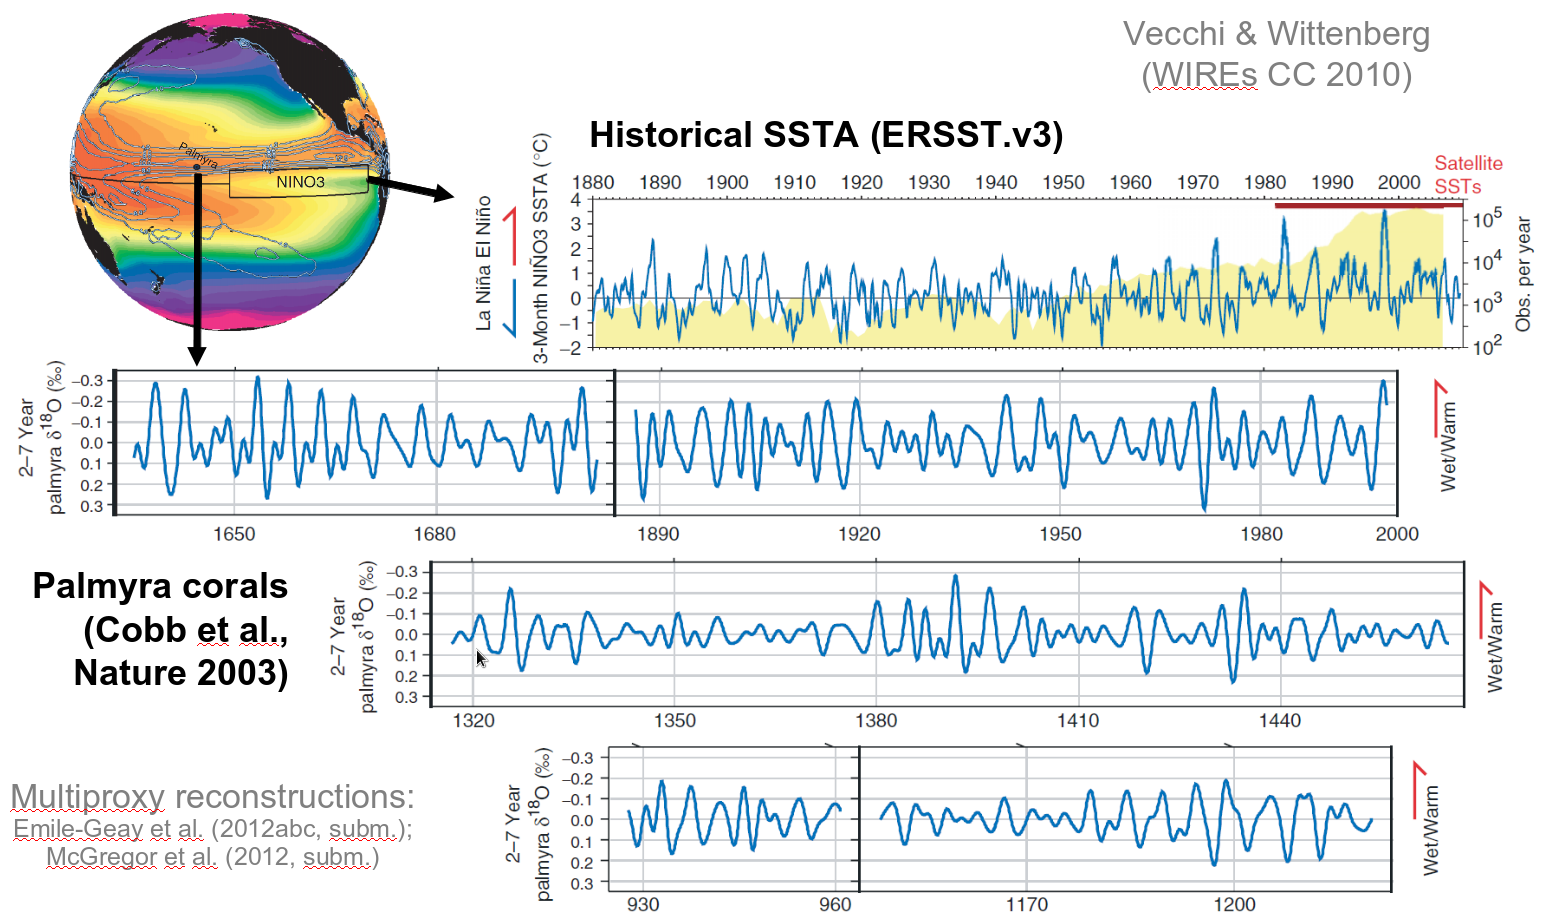
Instrumental and coral records of ENSO: In observations and paleo records, ENSO behavior is strongly modulated in time. Upper time series shows the monthly NINO3 SSTA index (blue line) from instrumental records. Lower time series show the 2-7-year filtered ratio of Oxygen-18 to Oxygen-16 isotope concentrations from corals taken from Palmyra Island, with positive values indicating warmer, wetter conditions associated with El Niño. From Vecchi and Wittenberg (2010).
Unforced ENSO modulation

Unforced ENSO modulation: Here is a 20-century simulation of sea surface temperature anomalies averaged over the eastern equatorial Pacific (NINO3) region, from a CM2.1 control run with unchanging pre-industrial climate forcings. Epochs of strong or weak ENSO activity emerge spontaneously and can last for decades (yellow) or even centuries (brown) — with important implications for model evaluation and comparison, and for societal risks associated with future ENSO events. From Wittenberg (2009).
ENSO diversity

ENSO diversity: Diversity of ENSO SST anomaly amplitudes and patterns, in the CM2.1 pre-industrial control simulation. From Capotondi and Wittenberg (2013).
Predictability of extreme ENSO epochs

Predictability of extreme ENSO epochs: Various unusual epochs from the CM2.1 pre-industrial control run (black line) are reforecast using the same model but with slightly-perturbed initial conditions. The resulting ensemble reforecasts are shown in blue. From Wittenberg et al. (2013).
Tropical climate change
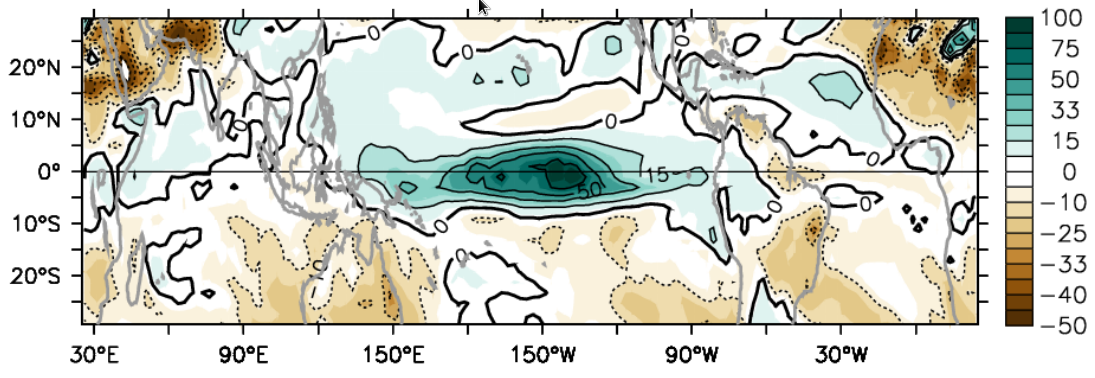
Tropical climate change: Future changes in tropical surface temperatures (°C, top) and rainfall (%, bottom), based on a 5-member ensemble-mean change over 2000-2050 from a CM2.1 simulation forced with SRES scenario A1B. The strongest warming is expected over land. The equatorial Pacific is also expected to see enhanced warming, with substantial increases in both the amount and interannual variability of rainfall. From Xie et al. (2010).
Is ENSO changing?
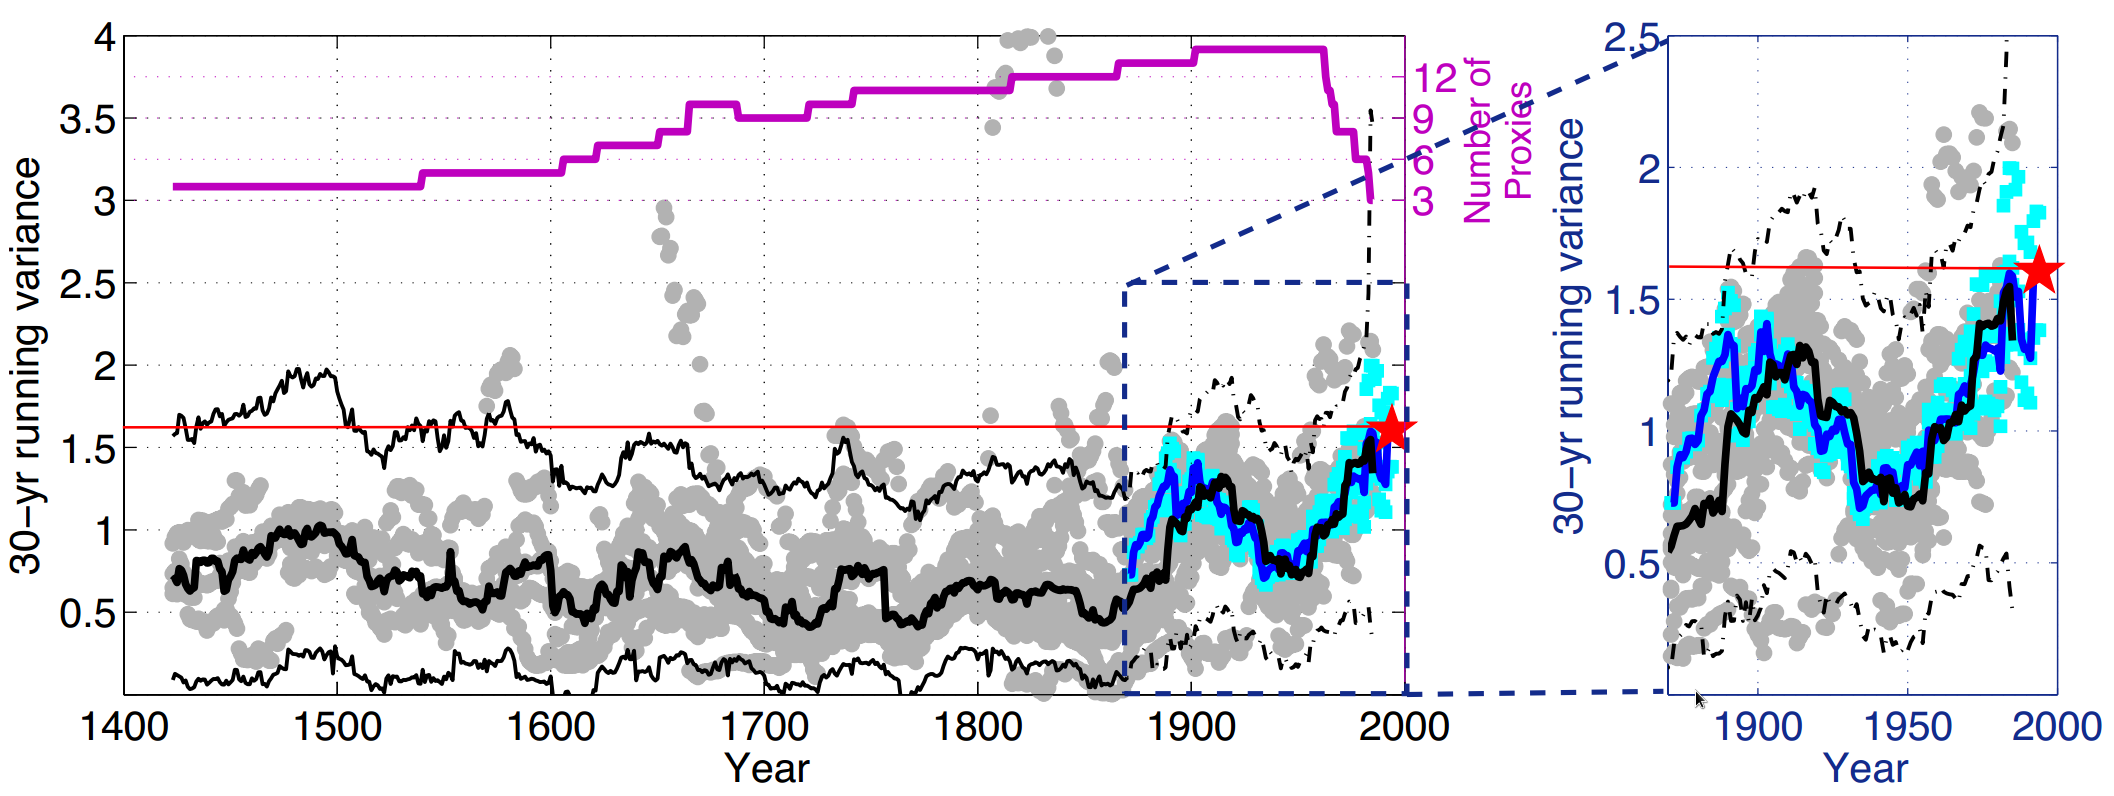
Is ENSO changing? Evidence from proxy records, like corals and tree rings, suggests that recent ENSO variance (red star) has been strong relative to the preceding six centuries. From McGregor et al. (2013).