

Land Use and Land-use Change
Dynamic Vegetation and Carbon Cycle Model
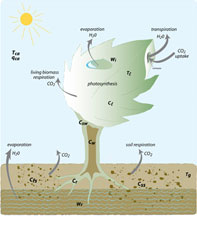
We have developed a dynamic land model (LM3V) able to simulate ecosystem dynamics and exchanges of water, energy and CO2 between land and atmosphere. LM3V is specifically designed to address the consequences of land-use/land-management changes including cropland and pasture dynamics, shifting cultivation, logging, fire, and resulting patterns of secondary regrowth. Our process-based model suggests a smaller net deforestation source than earlier bookkeeping models because it accounts for decelerated net conversion of primary forest to agriculture and for stronger secondary vegetation regrowth in tropical regions. The overall uncertainty is likely to be higher than the range reported here because of uncertainty in the biomass recovery under changing ambient conditions, including atmospheric CO2 concentration, nutrients availability and climate. Shevliakova et. al. 2009.
Representation of Land-use Change
The land model component (Shevliakova et al. 2009) of the GFDL ESMs (Dunne et al. 2012, 2013) is driven by scenarios of prescribed, annual, historical, land-use transition rates cumulative from 1500 (Chini et al. 2008; Hurtt et al. 2009), and includes wood harvesting and shifting cultivation. It is unique among CMIP5-class ESMs in that:
- it simulates the growth and age structure of secondary vegetation over time, accounting for the different sizes of carbon stores in young vs. old vegetation regrowth.
- the above- and below-ground carbon is accounted for underneath each subgrid tile, which represents 4 different land-use types, rather than each grid cell.
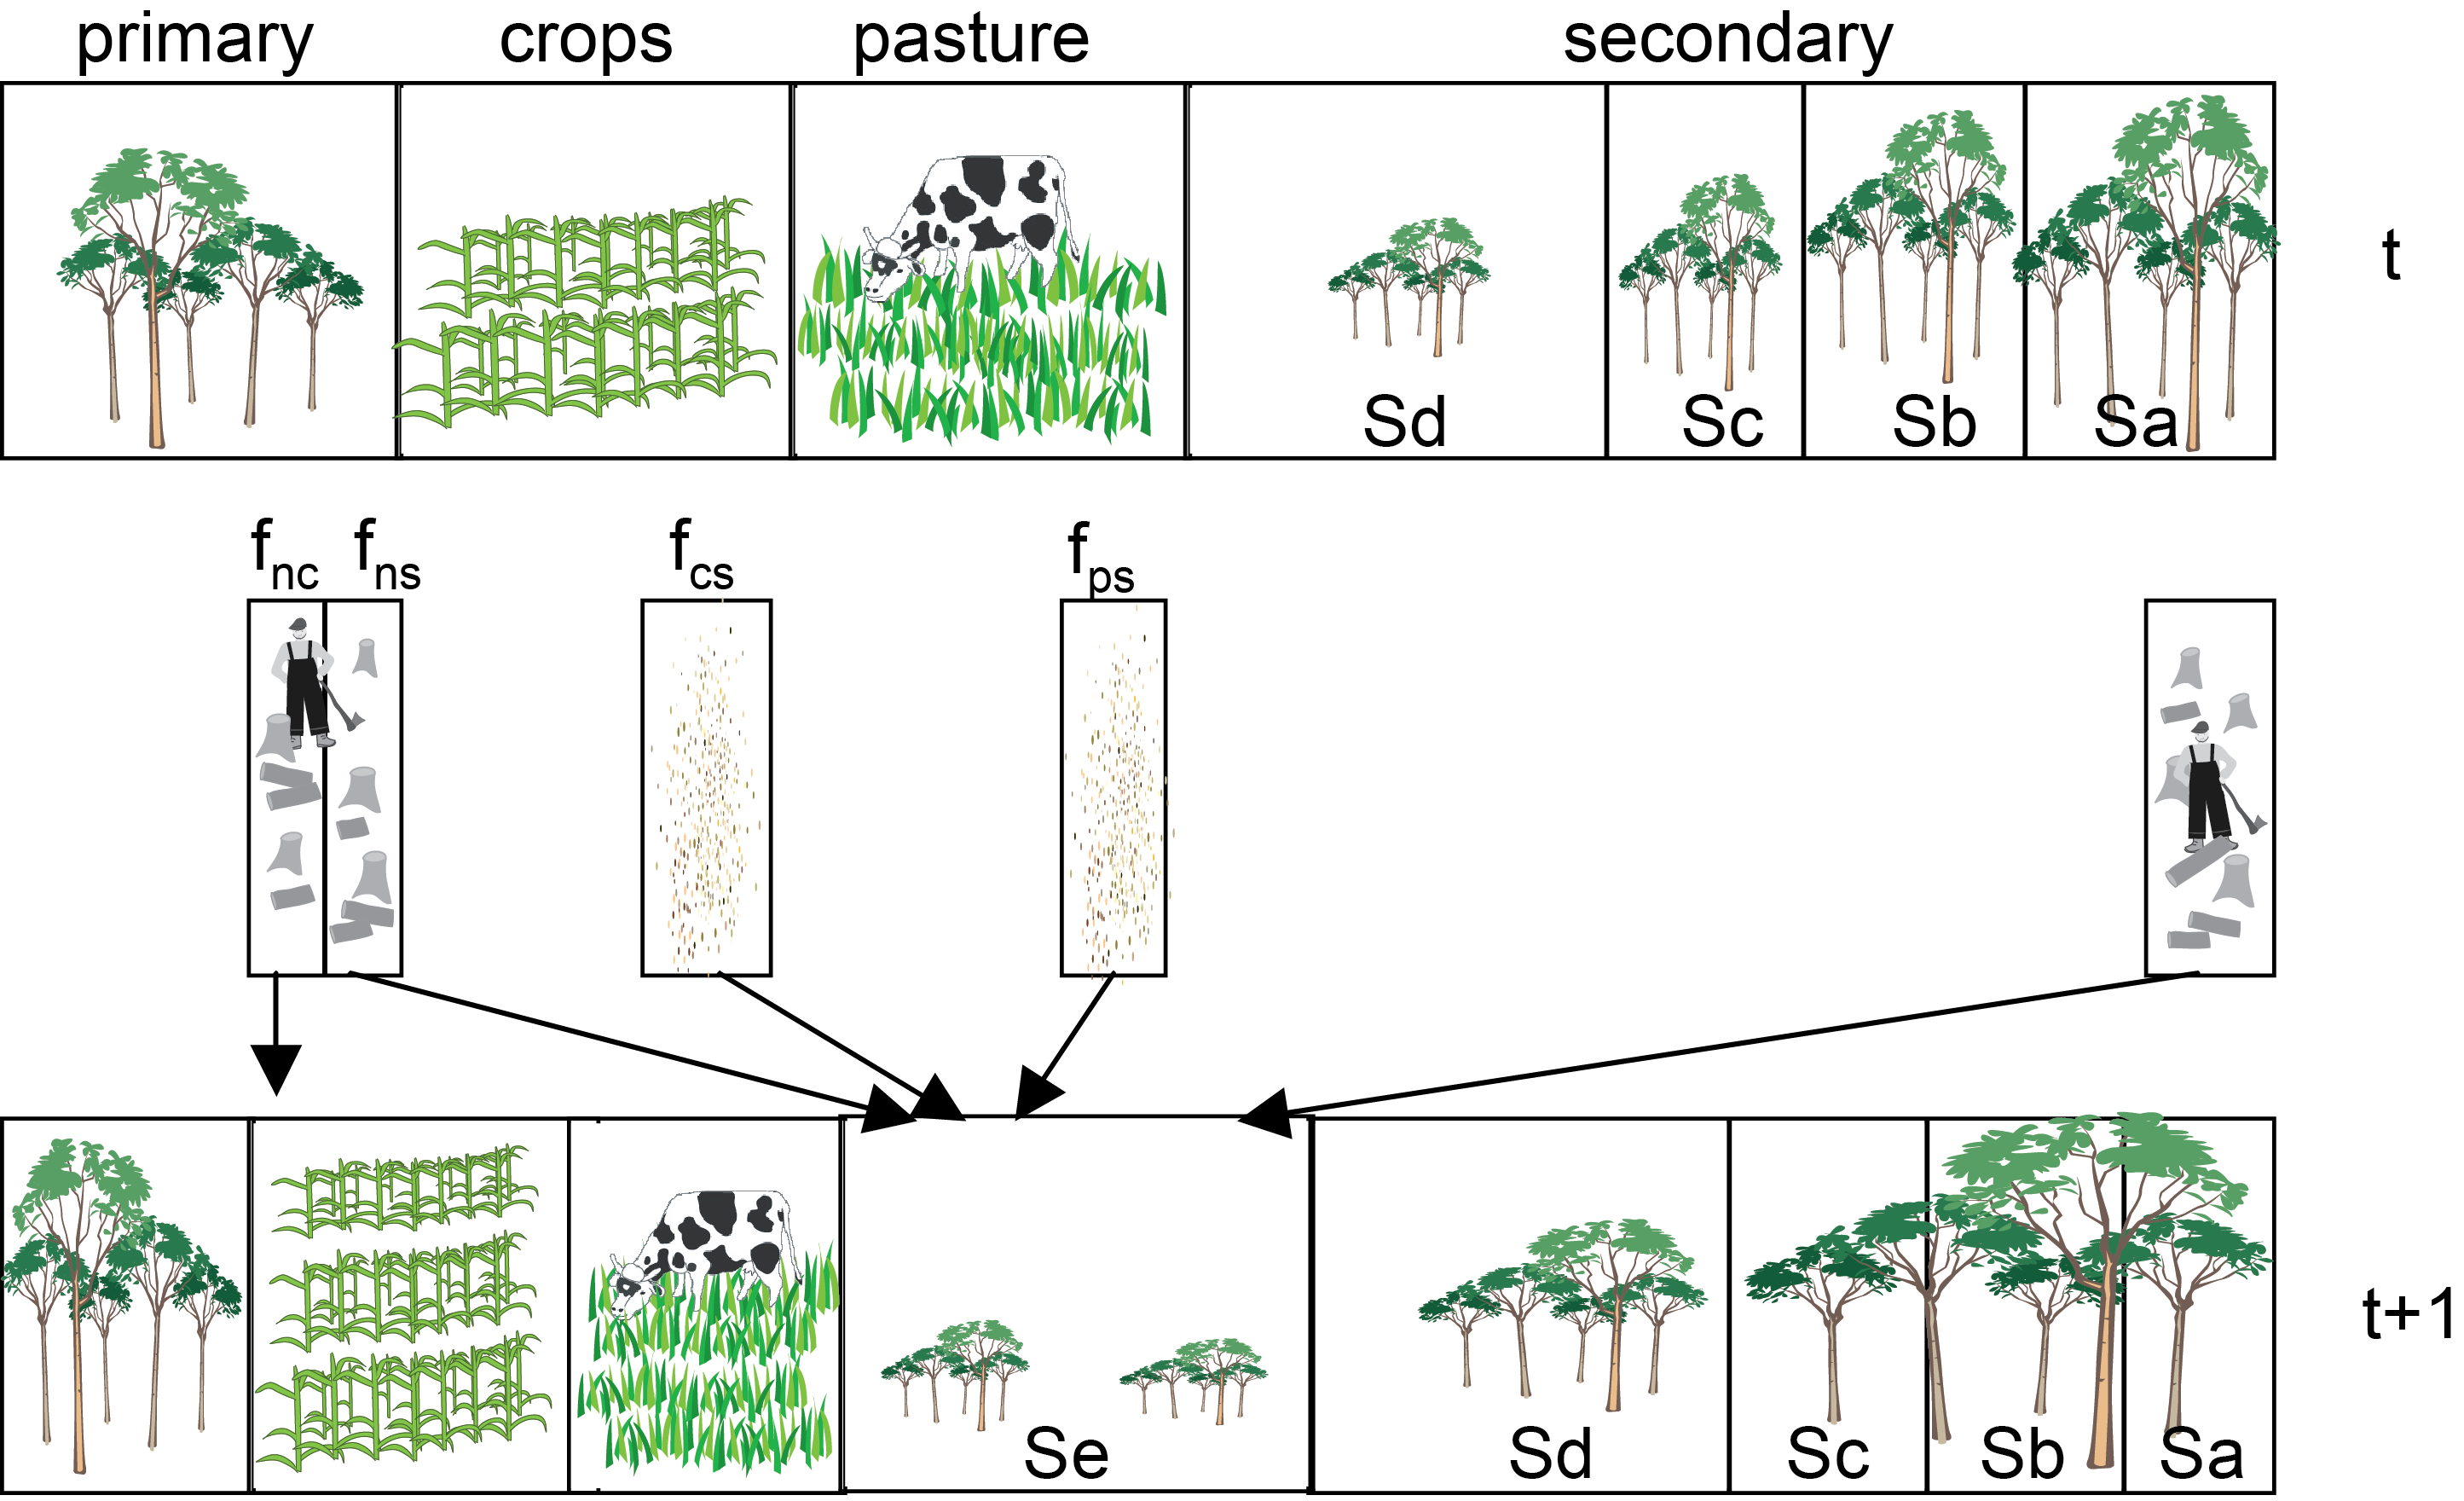
An example of the subgrid tile structure and land-use transitions in GFDL-LM3V. A fraction of natural forest (fnc) is cleared for cropland; a fraction of natural forest (fns) is cut for wood harvesting and is left to regrow; a fraction of cropland (fcs) and a fraction of pasture (fps) are abandoned; and a fraction of secondary forest (fss) is harvested for wood. After transitions, the areas of natural, cropland, pasture and secondary tiles are updated and a new secondary tile (Se) is formed (Shevliakova et al. 2009, Fig. 1).
Historical Integrations with Land-use
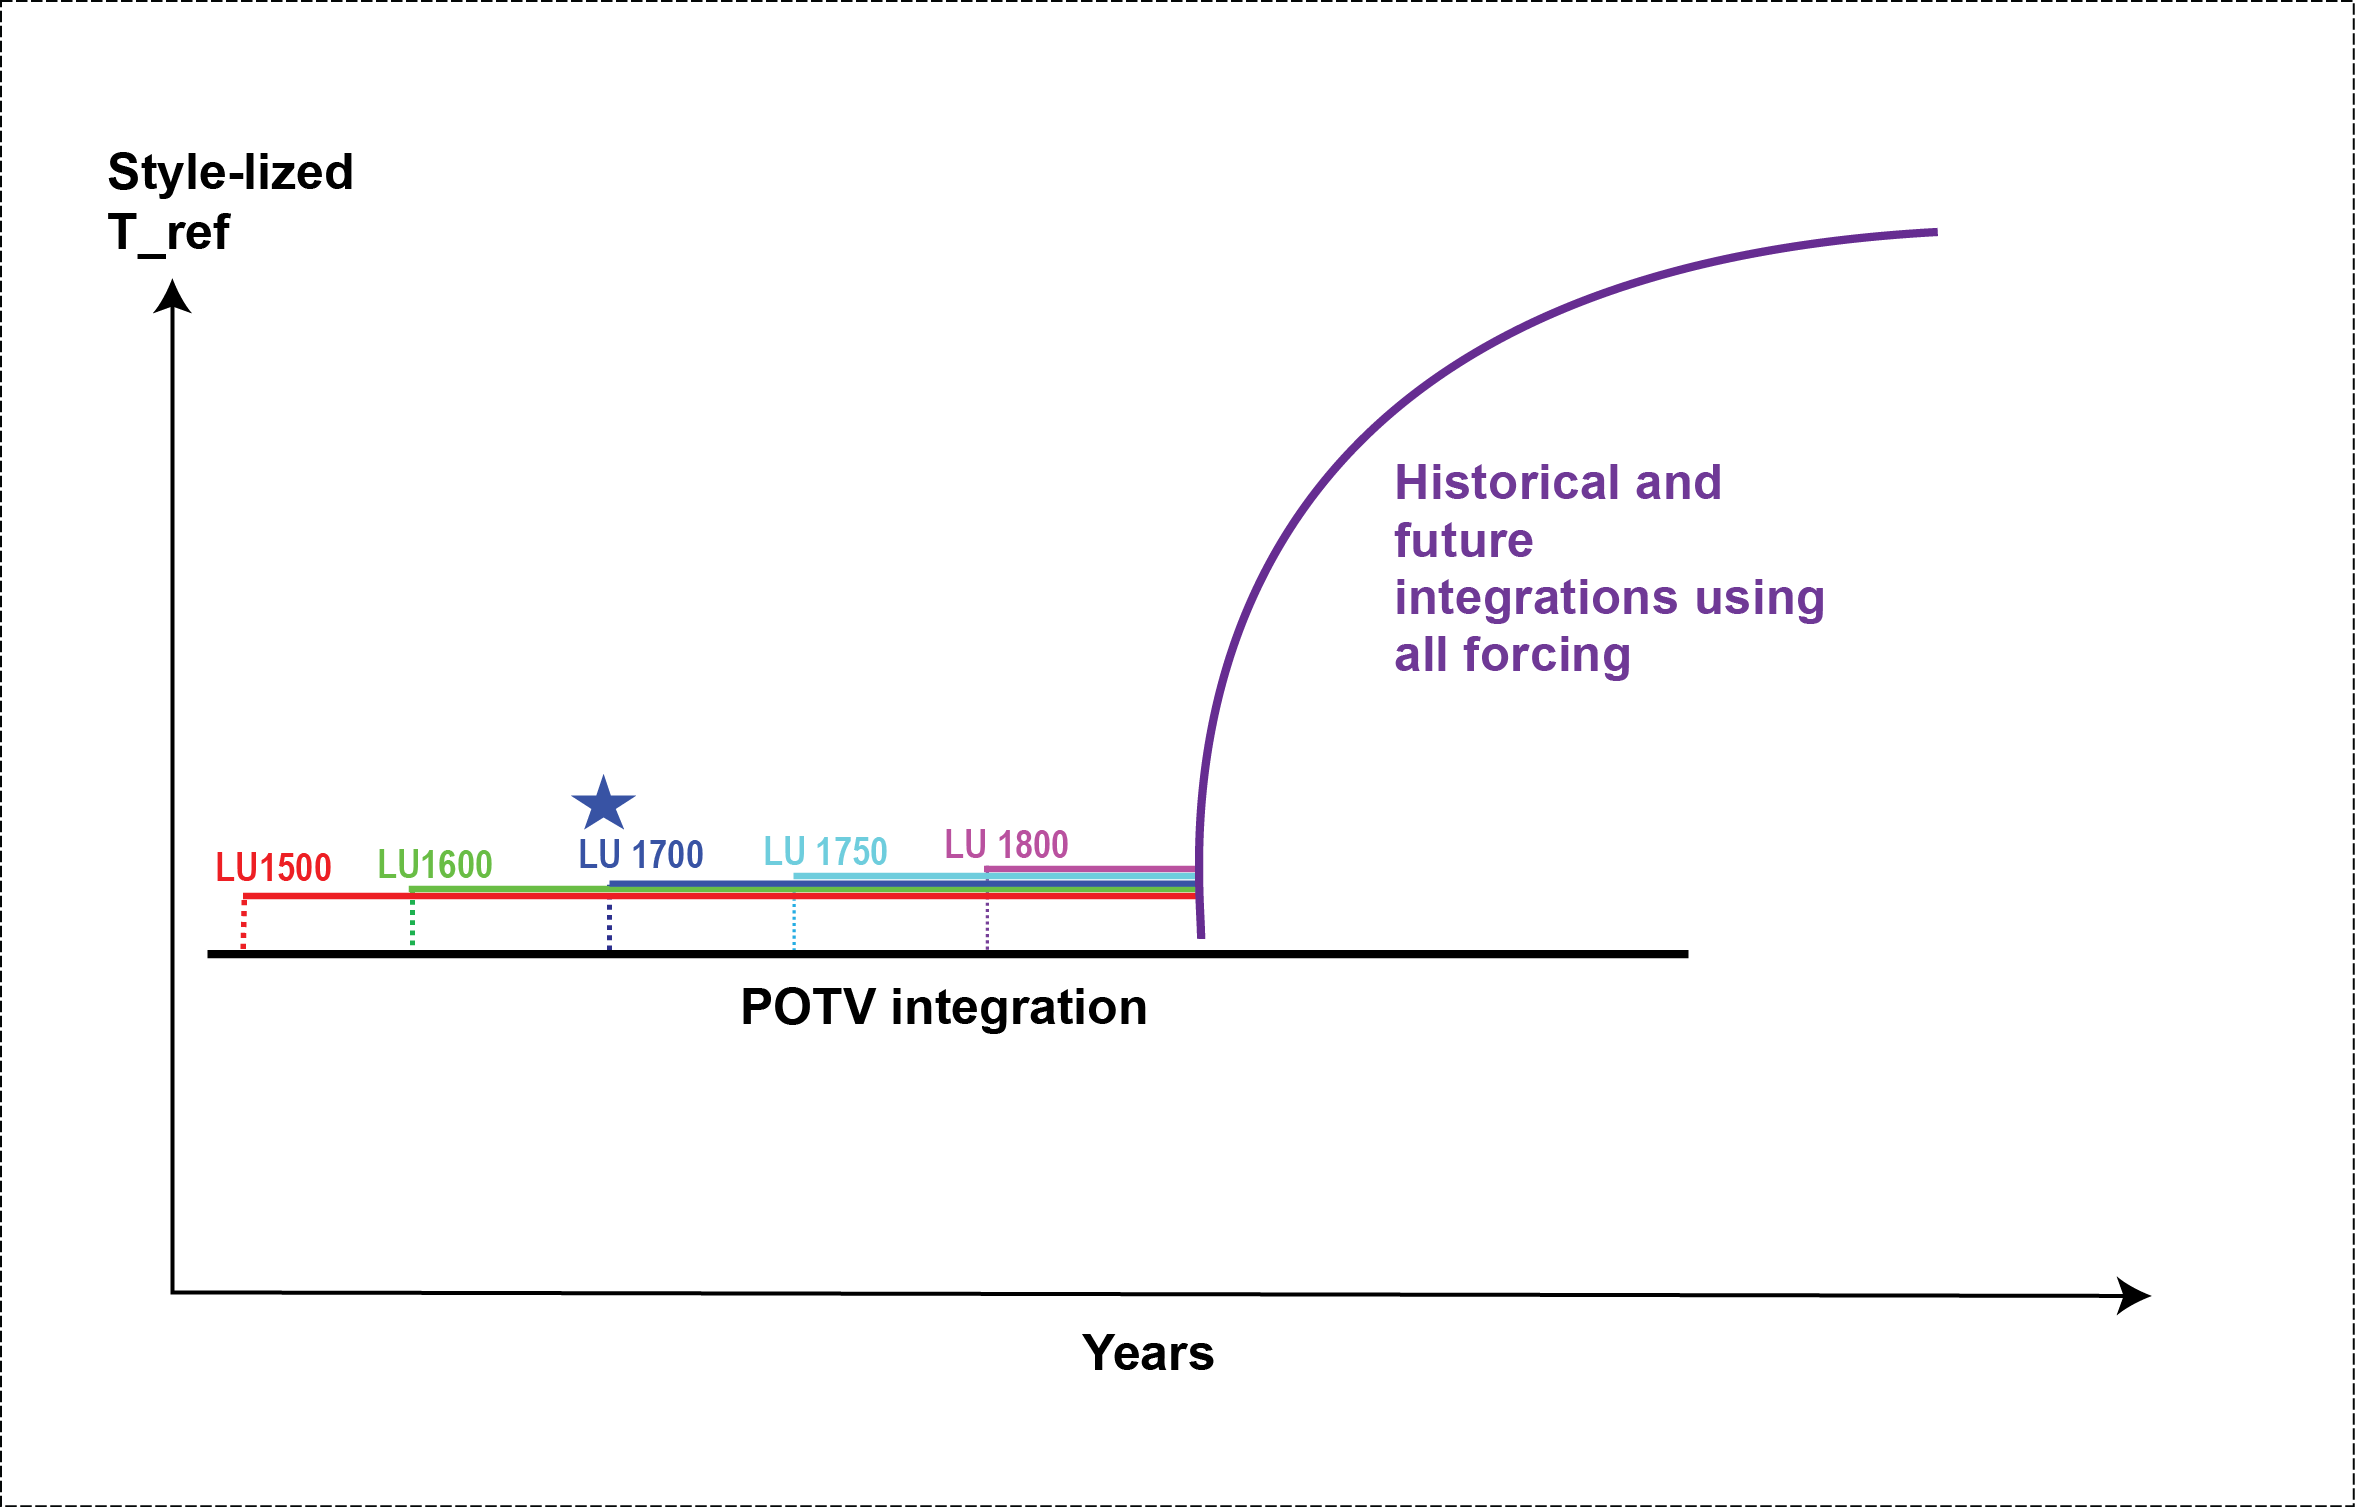
Schematic of experimental design for integrating a historical experiment with land use using GFDL’s ESMs. The lines represent the global surface air temperature for the 1860 control (black) and historical and future (purple) integrations. The five lines (red – LU1500, green – LU1600, blue – LU1700, cyan – LU1750 and magenta – LU1800) correspond to GFDL-LM3V integrations started from the 1860 control where only historical land-use changes are applied. The blue line and star correspond to the GFDL ESM integrations for CMIP5 started from the 1860 control where only historical land-use changes are applied starting in 1700 (Sentman et al. 2011, Fig. 1).