

Ocean Data Assimilation Experiment
![]()
An improved ocean state product
The main goal of this project is to develop a state-of-the-art data assimilation system that incorporates near-realtime data with which we can provide the community a high quality ocean state product. This assimilation system consists of an Ensemble Filter applied to GFDL’s second generation fully coupled climate model (CM2.1, Delworth et al. [2006]). The ocean component of the coupled data assimilation (CDA) is the fourth version of the Modular Ocean Model (MOM4, Griffies et al. [2004]) configured with 50 vertical levels (22 levels of 10-m thickness each in the top 220 m) and 1° horizontal B-grid resolution, telescoping to 1/3° meridional spacing by 1° near the equator.
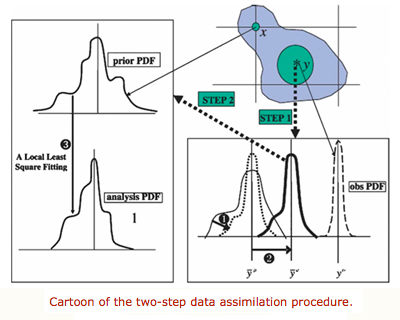
To the right is a cartoon from Zhang et al. [2007]. It illustrates how a two-step data assimilation procedure works for updating the estimate of the probability distribution of a single state variable x given a single observation y in the ensemble adjustment filter under the least squares framework. The right-hand column represents step 1: updating the probability density function (PDF) at the observation location as a new observation comes in (denoted by the thick-dotted arrow labeled STEP 1). The solid arrow 1 denotes that the prior PDF at the observation location is squashed by a new observation (denoted by the bottom-right dashed curve) and the solid arrow 2 represents the shift of the prior ensemble mean at the observation location due to the new observation. The thick-dotted arrow extending from the right-hand column to the left-hand column denotes step 2: using the correlation distribution (shaded region) to distribute the observation increments to impacted grid points. The solid arrow 3 represents the process of updating the PDF of a grid point.
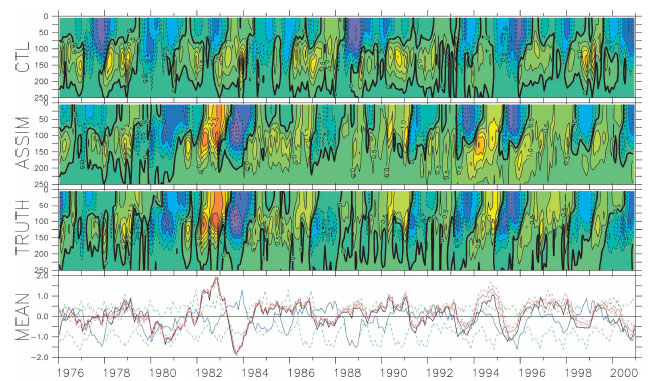
The figure to the above shows anomalies of the Niño-3.4 ocean temperature for the control (denoted CTL), the ODA (denoted ASSIM), and the truth. Curves in the bottom panel are the vertical averages over the top 250 m for the control (blue), the ODA (red), and the truth (black). The upper (lower) bounds of the control-ODA spread are plotted by the green-dashed (pink dashed) lines in the bottom panel. The control (model climatological) spread is estimated by six 25-yr nonoverlapping time series and the ODA spread is computed by six ensemble members in the filter. All anomalies are computed using the truth’s climatology, and the contour interval for the first three panels is 0.5°C. More details about CDA system can be found in Zhang et al. [2007] and Zhang et al. [2008a ,b and c]. Griffies et al. [2004];
A marked improvement in the data assimilation’s skill is seen when the Argo observational data is included (Chang et al. [2008]). Argo is a global array of 3,000 free-drifting profiling floats that measures the temperature and salinity of the upper 2000 m of the ocean. This allows, for the first time, continuous monitoring of the temperature, salinity, and velocity of the upper ocean, with all data being relayed and made publicly available within hours after collection (http://www-argo.ucsd.edu). Below is shown the positions of the floats that have delivered data within the last 30 days

ODA home
ODA output
GSOP
Bibliography
Recent Publications
Chang, Y.-S., S. Zhang, A. Rosati, T. Delworth, and W. F. Stern, March 2012: An assessment of oceanic variability for 1960-2010 from the GFDL ensemble coupled data assimilation, Climate Dynamic, Accepted.
Zhang, Shaoqing, M. Winton, A. Rosati, T. Delworth and B. Huang, 2012: Impact of Enthalpy-Based Ensemble Filtering Sea-Ice Data Assimilation on Decadal Predictions: Simulation with a Conceptual Pycnocline Prediction Model. Journal of Climate. in press.
Chang, Y-S, Anthony Rosati, and Shaoqing Zhang, February 2011: A construction of pseudo salinity profiles for the global ocean: Method and evaluation. Journal of Geophysical Research, 116, C02002, DOI:10.1029/2010JC006386.
Chang, Y-S, Shaoqing Zhang, and Anthony Rosati, July 2011: Improvement of salinity representation in an ensemble coupled data assimilation system using pseudo salinity profiles. Geophysical Research Letters, 38, L13609, DOI:10.1029/2011GL048064.
Zhang, Shaoqing, January 2011: Impact of observation-optimized model parameters on decadal predictions: Simulation with a simple pycnocline prediction model. Geophysical Research Letters, 38, L02702, DOI:10.1029/2010GL046133.
Zhang, Shaoqing, Z Liu, Anthony Rosati, and Thomas L Delworth, January 2012: A study of enhancive parameter correction with coupled data assimilation for climate estimation and prediction using a simple coupled model. Tellus A, 64, 10963, DOI:10.3402/tellusa.v64i0.10963. PDF
Zhang, Shaoqing, January 2011: Impact of observation-optimized model parameters on decadal predictions: Simulation with a simple pycnocline prediction model. Geophysical Research Letters, 38, L02702, DOI:10.1029/2010GL046133
Zhang, Shaoqing, December 2011:A study of impacts of coupled model initial shocks and state-parameter optimization on climate predictions using a simple pycnocline prediction model. Journal of Climate, 24(23), DOI:10.1175/JCLI-D-10-05003.1. PDF