January 10th, 2020
Key Findings
- A prototype of a new GFDL chemistry-climate model, AM4.1, was used to explore the contributions of methane sources and sinks to its observed trends and variability.
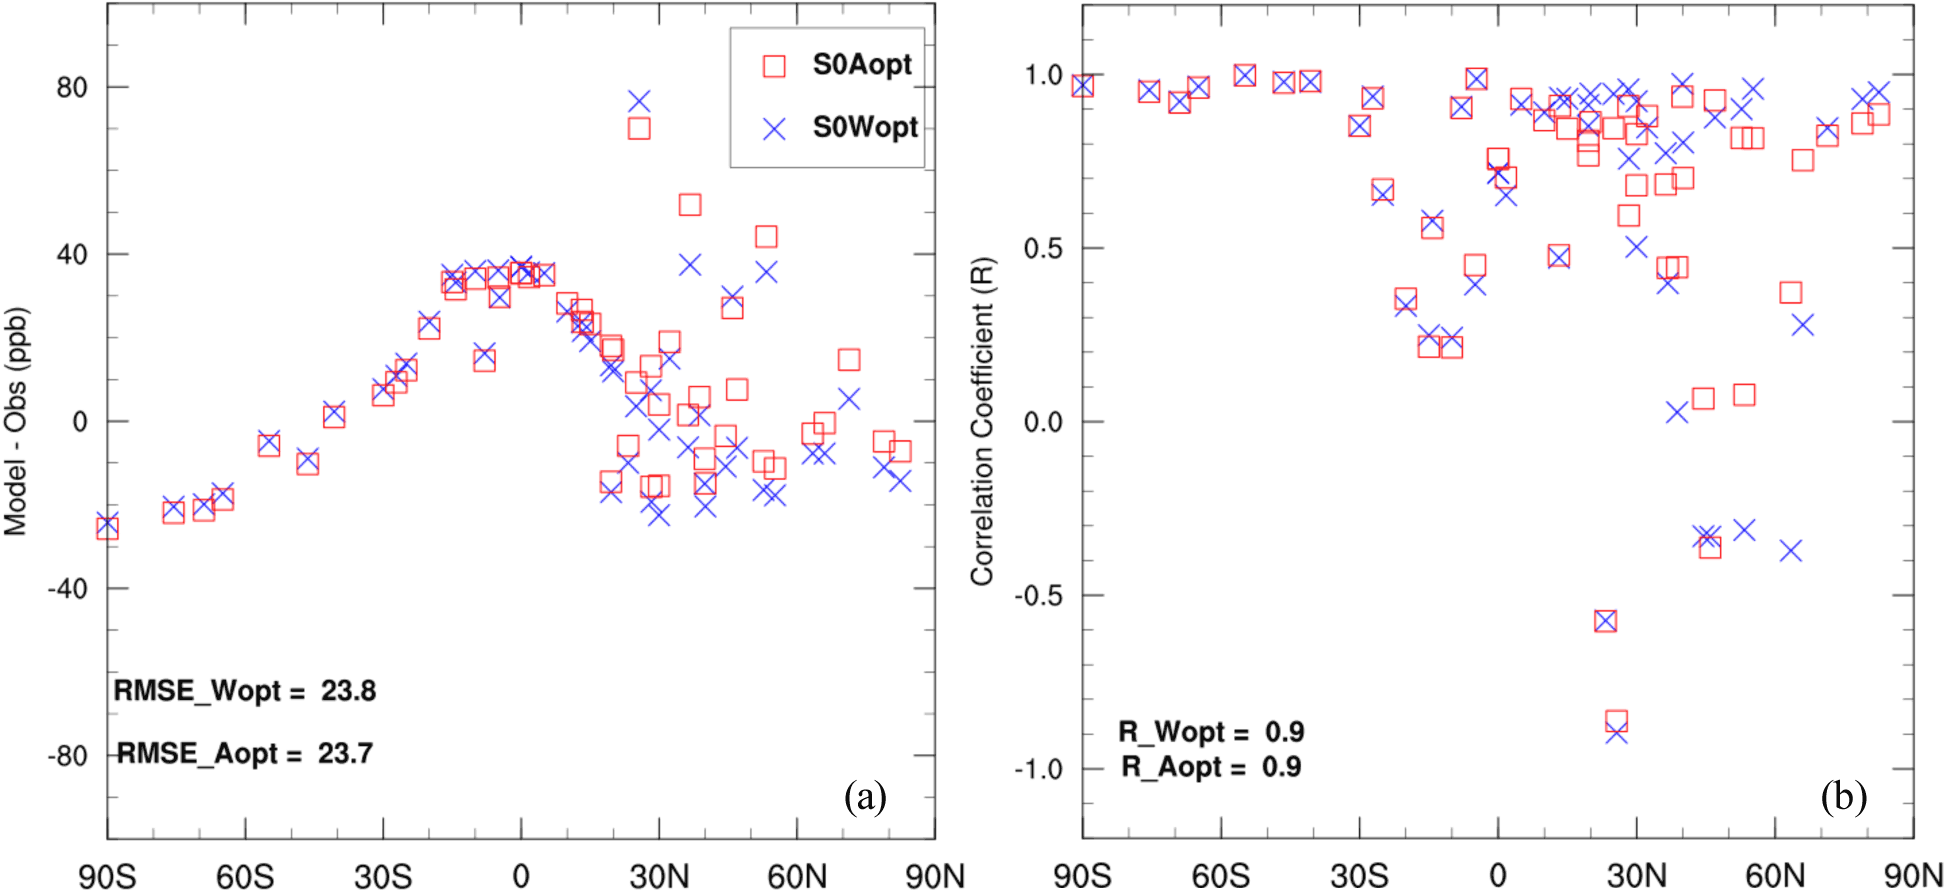
- The AM4.1 simulations with improved methane representations and optimized global emissions are generally able to capture the observed global trend, variability, seasonal cycle, and latitudinal gradient of methane.
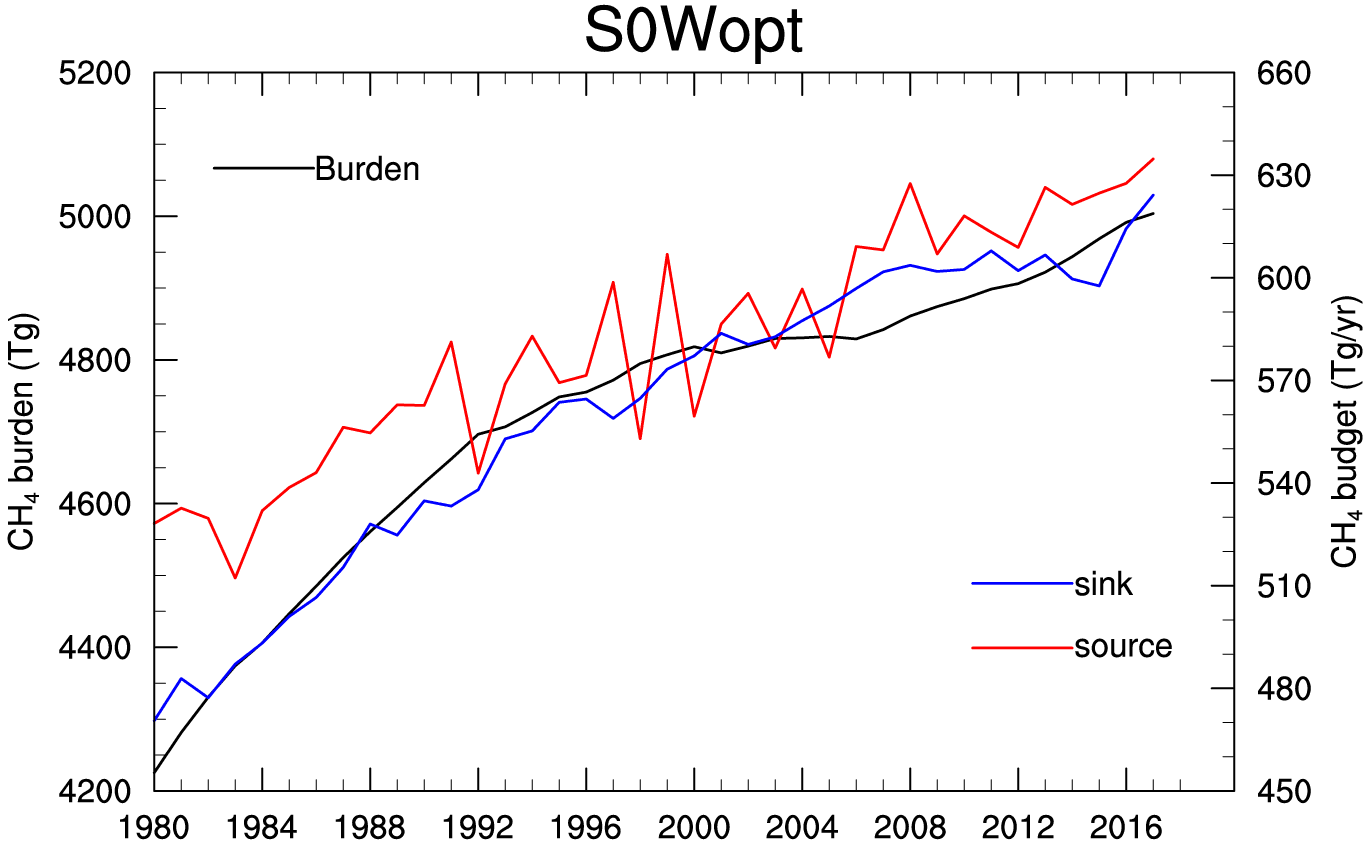
- Increases in methane sources balanced by increases in methane sinks lead to methane stabilization during 1999-2006, and increases in methane sources combined with little change in sinks lead to renewed methane growth after 2007.
- 1% change in OH levels could lead to an annual mean of ~ 4 Tg yr-1 difference in the optimized emissions and 0.08 year difference in the estimated tropospheric methane lifetime.
Jian He, Vaishali Naik, Larry W. Horowitz, Ed Dlugokencky, and Kirk Thoning. Atmospheric Chemistry and Physics. DOI: 10.5194/acp-20-805-2020
Changes in atmospheric methane abundance have implications for both chemistry and climate, as methane is both a strong greenhouse gas and an important precursor for tropospheric ozone. The global network of methane surface observations over the past 3-4 decades indicates that methane went through a period of rapid growth from the 1980s to 1990s, nearly stabilized from 1999 to 2006, and then renewed its rapid growth.
Studies of the drivers of observed changes in methane trends and variability have focused on the contributions from changes in methane sources and sinks. The authors applied a prototype version of new generation Geophysical Fluid Dynamics Laboratory chemistry-climate model, AM4.1 (Zhao et al., 2018a, b; Horowitz et al., 2020) with an improved representation of methane, to explore the contributions of methane sources and sinks to its observed trends and variability. The main objectives of this effort were to improve the representation of methane in AM4, to comprehensively evaluate the model performance of methane predictions with an improved representation of methane budget, and to investigate possible drivers of the methane trends and variability.
The improved methane representation in AM4.1 will provide a better understanding of the drivers of trends and variability in methane abundance over the recent past, which is critical for building confidence in projections of future methane levels and methane climate impacts. Controlling methane has been shown to be a win-win for both climate and air quality (Shindell et al., 2012). The better understanding of methane trends and variability, as well as climate impacts, can guide decision makers to develop and evaluate options that control anthropogenic methane sources (e.g., fossil fuel and agricultural activities) and adapt to foreseeable climate impacts.