

Data Visualizations – Climate Predictions
These animations are offered as examples of scientific research results, to convey complex information in graphic form.
Redistribution of these materials is permitted, but we ask that NOAA/GFDL be credited as the source, and that we be informed of the usage. Please also see our Disclaimers and Privacy Policy. You can also create visualizations with some of GFDL’s climate data using NOAA’s data exploration tool, NOAAView.
For questions, please contact oar.gfdl.communications@noaa.gov
Patterns of Greenhouse Warming
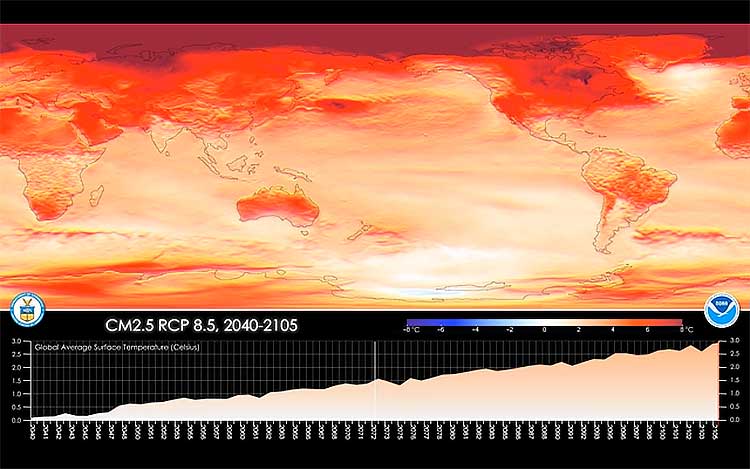
Global Surface Temperature CM2.5, RCP 8.5 forcing
This animation shows projections for surface air temperature anomalies and global mean temperature for the years 2040 to 2105 under Representative Concentration Pathways (RCPs), RCP8.5.
Details
Title |
Global Surface Temperature CM2.5, RCP 8.5 forcing |
Description |
This animation shows projections for surface air temperature anomalies and global mean temperature for the years 2040 to 2105 under Representative Concentration Pathways (RCPs), RCP8.5. |
Model name |
CM2.5 |
Scientist(s) |
Tom Delworth, Tony Rosati, Whit Anderson, Fanrong Zhang |
Date Created |
November 2015 |
Visualization personnel |
Whit Anderson |
Files |
MPEG |
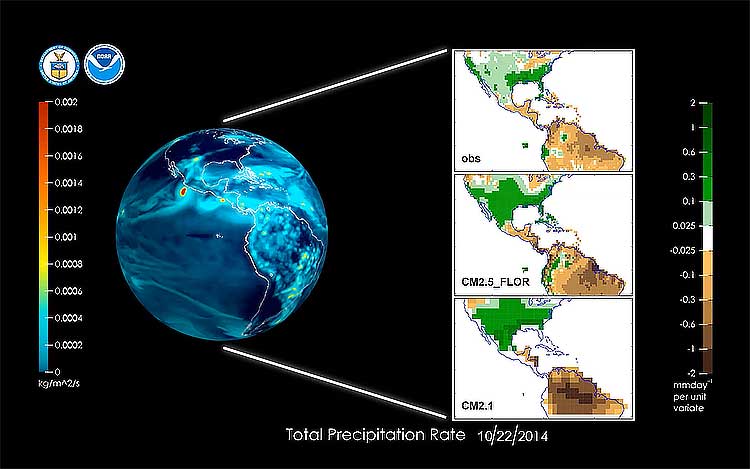
CM2.5-FLOR (Forecast-oriented Low Ocean Resolution) Forecast System
This animation is used to demonstrate the change in solution complexity and model skill when moving from the lower atmosphere resolution…
Details
Title |
CM2.5-FLOR (Forecast-oriented Low Ocean Resolution) Forecast System. (Presented at the 20th United Nations Conference of The Parties at Lima, Peru in December 2014.) |
Description |
This animation is used to demonstrate the change in solution complexity and model skill when moving from the lower atmosphere resolution CM2.1 Model to the CM2.5-FLOR (Forecast-oriented Low Ocean Resolution) Forecast System. Shown here is a single member from the CM2.5-FLOR model ensemble. The animation showcases the forecast initialized fall 2014 and runs through summer 2015. |
Model name |
CM2.5-FLOR (Forecast-oriented Low Ocean Resolution) Forecast System. |
Scientist(s) |
Whit Anderson, Tom Delworth, Tony Rosati, Gabriel Vecchi |
Date Created |
December 2014 |
Visualization personnel |
Whit Anderson |
Files |
MPEG |
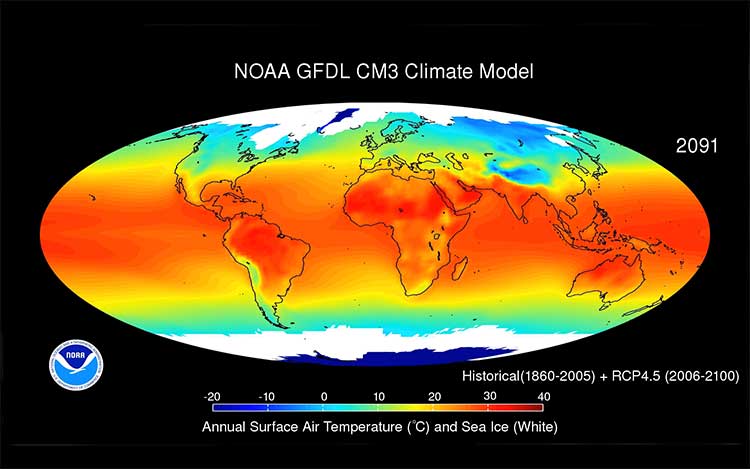
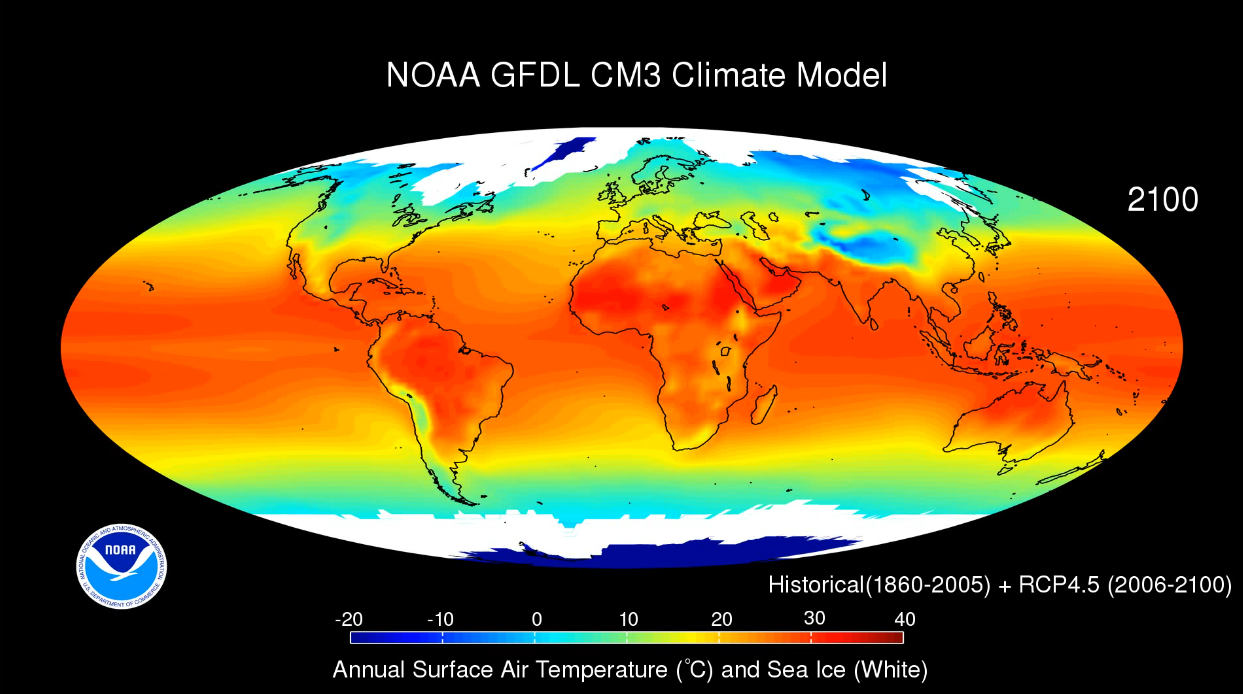
NOAA GFDL CM3 Climate Model
This animation shows the time evolution of annual mean surface air temperature and sea-ice cover over the historical time period (1860-2005) and projected over the 21st century…
Details
Title |
NOAA GFDL CM3 Climate Model |
Description |
This animation shows the time evolution of annual mean surface air temperature and sea-ice cover over the historical time period (1860-2005) and projected over the 21st century (2006-2100), as simulated by the NOAA GFDL CM3 climate model. Projection over the 2006-2100 time period is based on Representative Concentration Pathway 4.5 (RCP 4.5) developed in support of the Fifth Assessment Report of the Intergovernmental Panel on Climate Change (IPCC-AR5). Concentrations and emissions of greenhouse gases, ozone depleting substances, and short-lived air pollutants including aerosols follow a “medium-low” trajectory resulting in the net radiative forcing of 4.5 Watts per square meter (equivalent to increasing carbon dioxide alone by a factor of about 2.3x) by 2100. More information on RCP scenarios is provided on the RCP emission scenario website. |
Model name |
Coupled Climate Model (CM 3) |
Scientist(s) |
Larry Horowitz |
Date Created |
April 2010 |
Visualization personnel |
Paidemwoyo Munhutu, Vaishali Naik |
Files |
MPEG (55MB) AVI (416MB) PNG (423KB) |
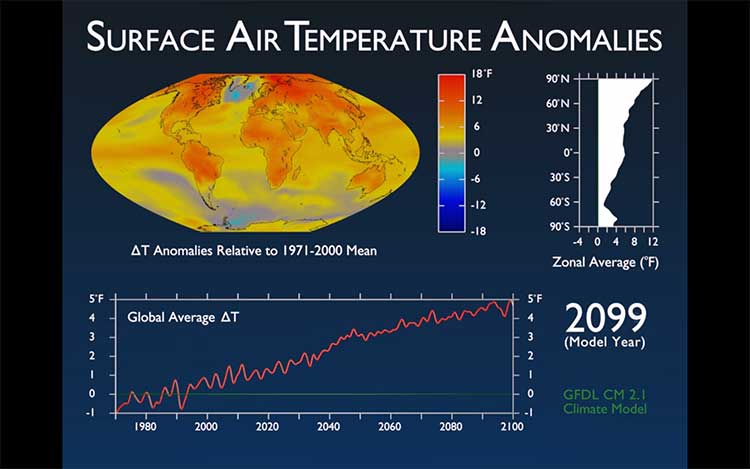
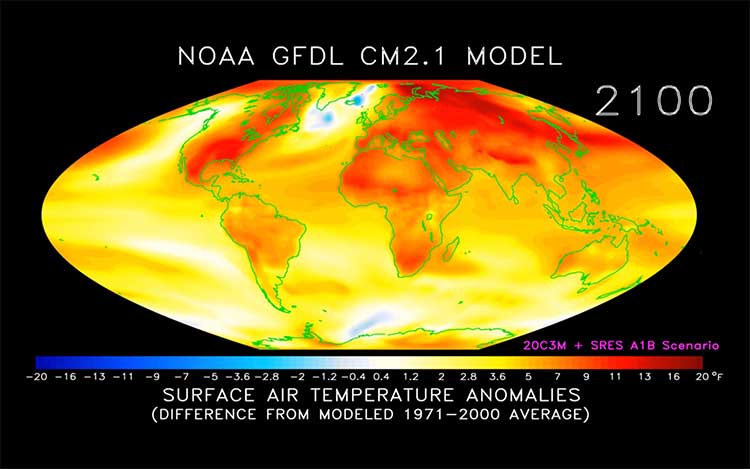
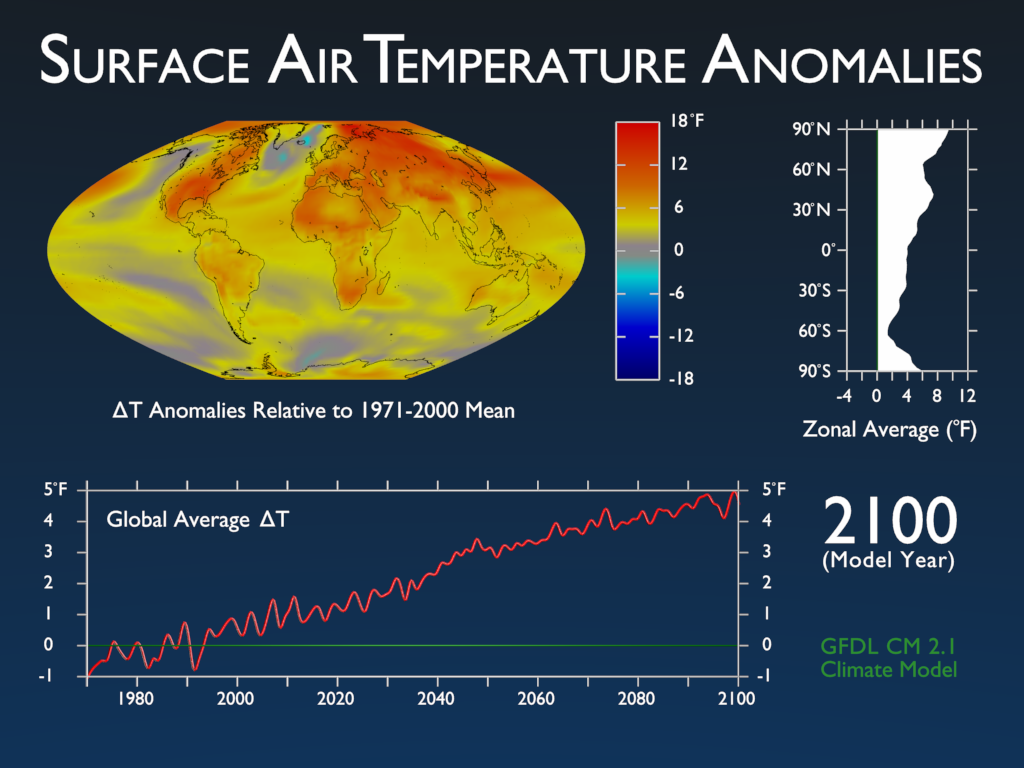
Surface Air Temperature Anomalies
Coupled Climate Model (CM 2.1) projection of surface air temperature anomalies from years 1971-2100.
Details
Title |
Surface Air Temperature Anomalies |
Description |
Coupled Climate Model (CM 2.1) projection of surface air temperature anomalies from years 1971-2100. |
Model name |
Coupled Climate Model (CM 2.1) |
Scientist(s) |
Keith Dixon |
Date Created |
October 2005 |
Visualization personnel |
Remik Ziemlinski |
Files |
MPEG (2.4MB) PNG (244KB) TIF |
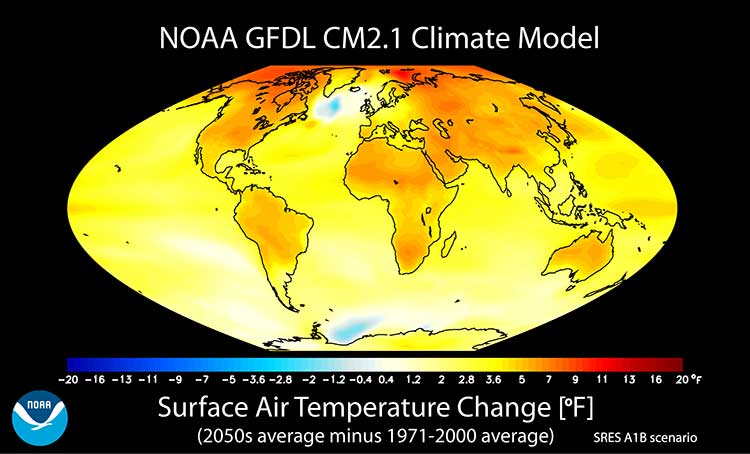
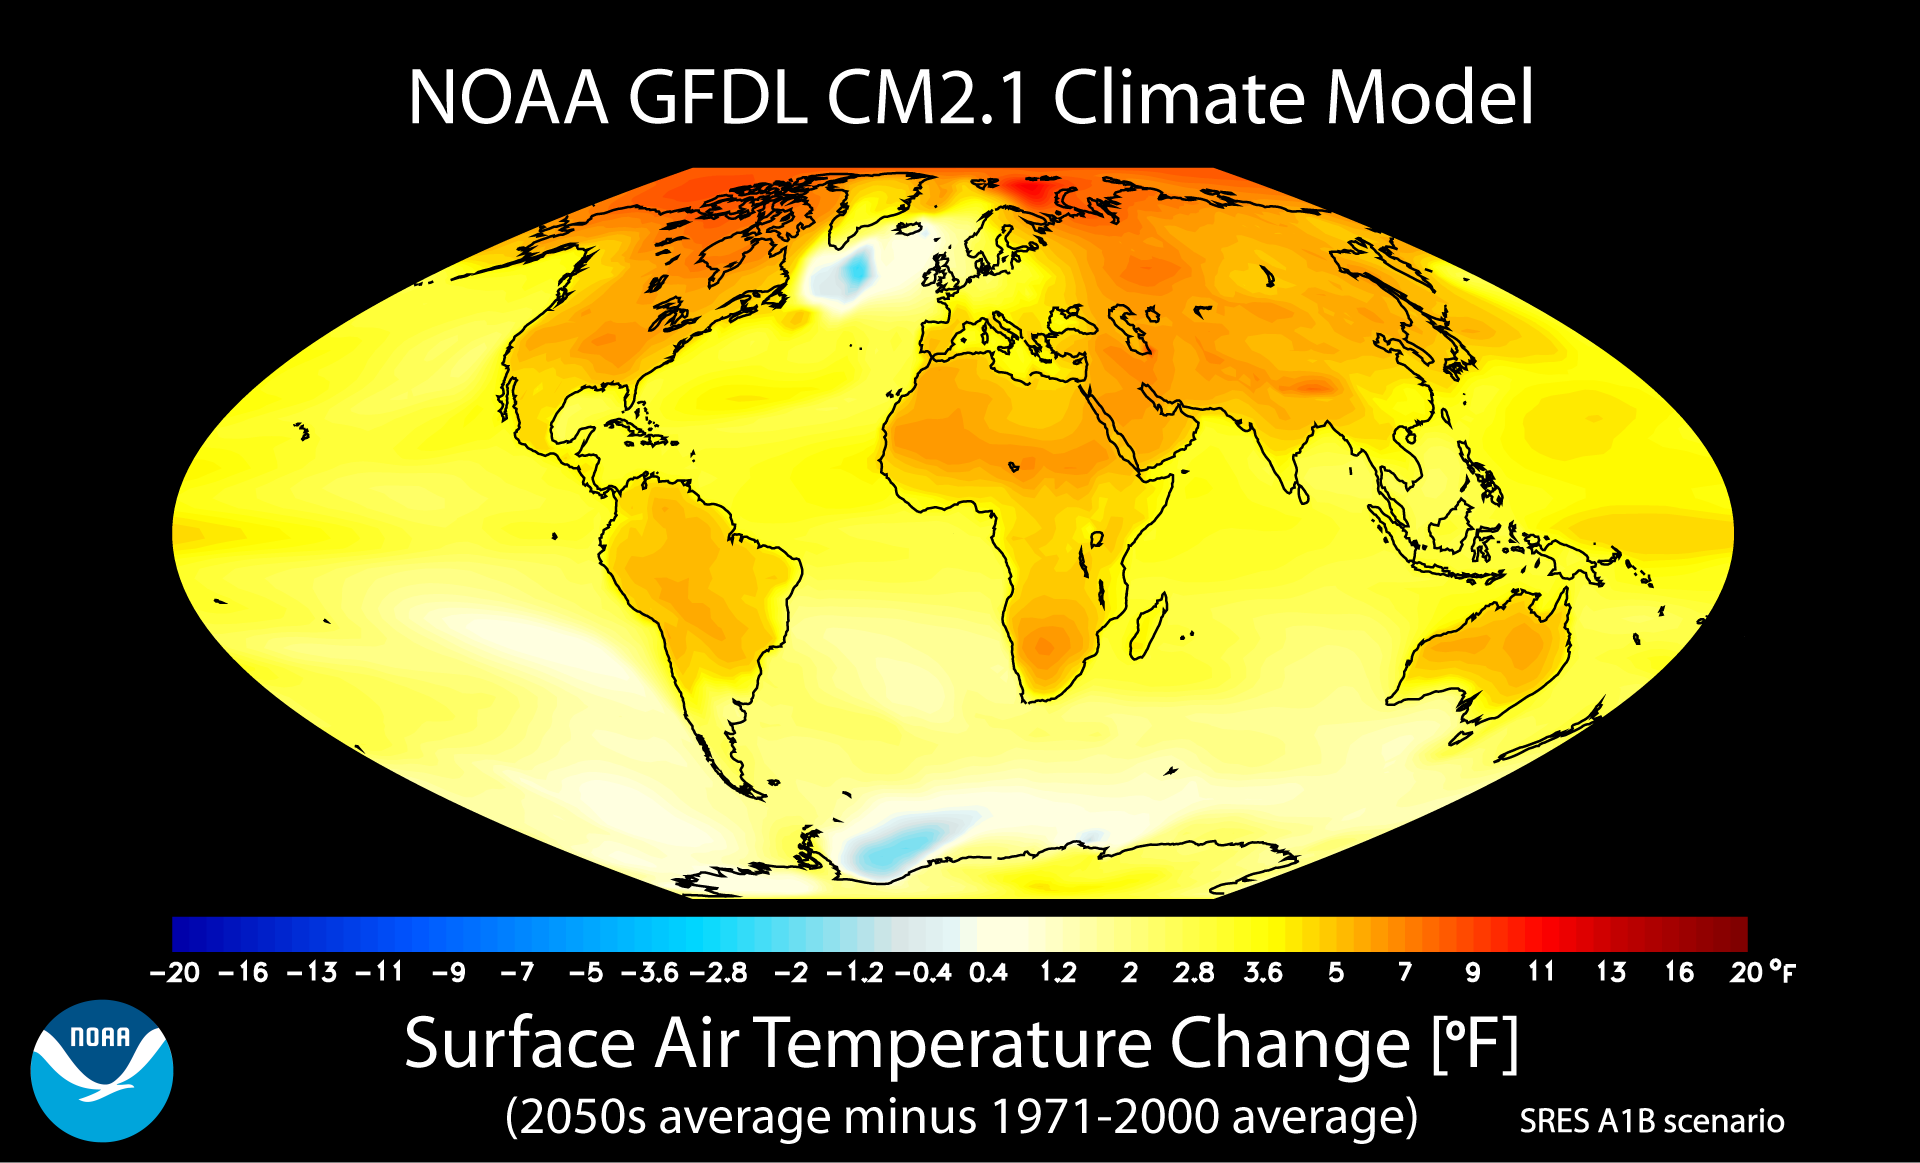
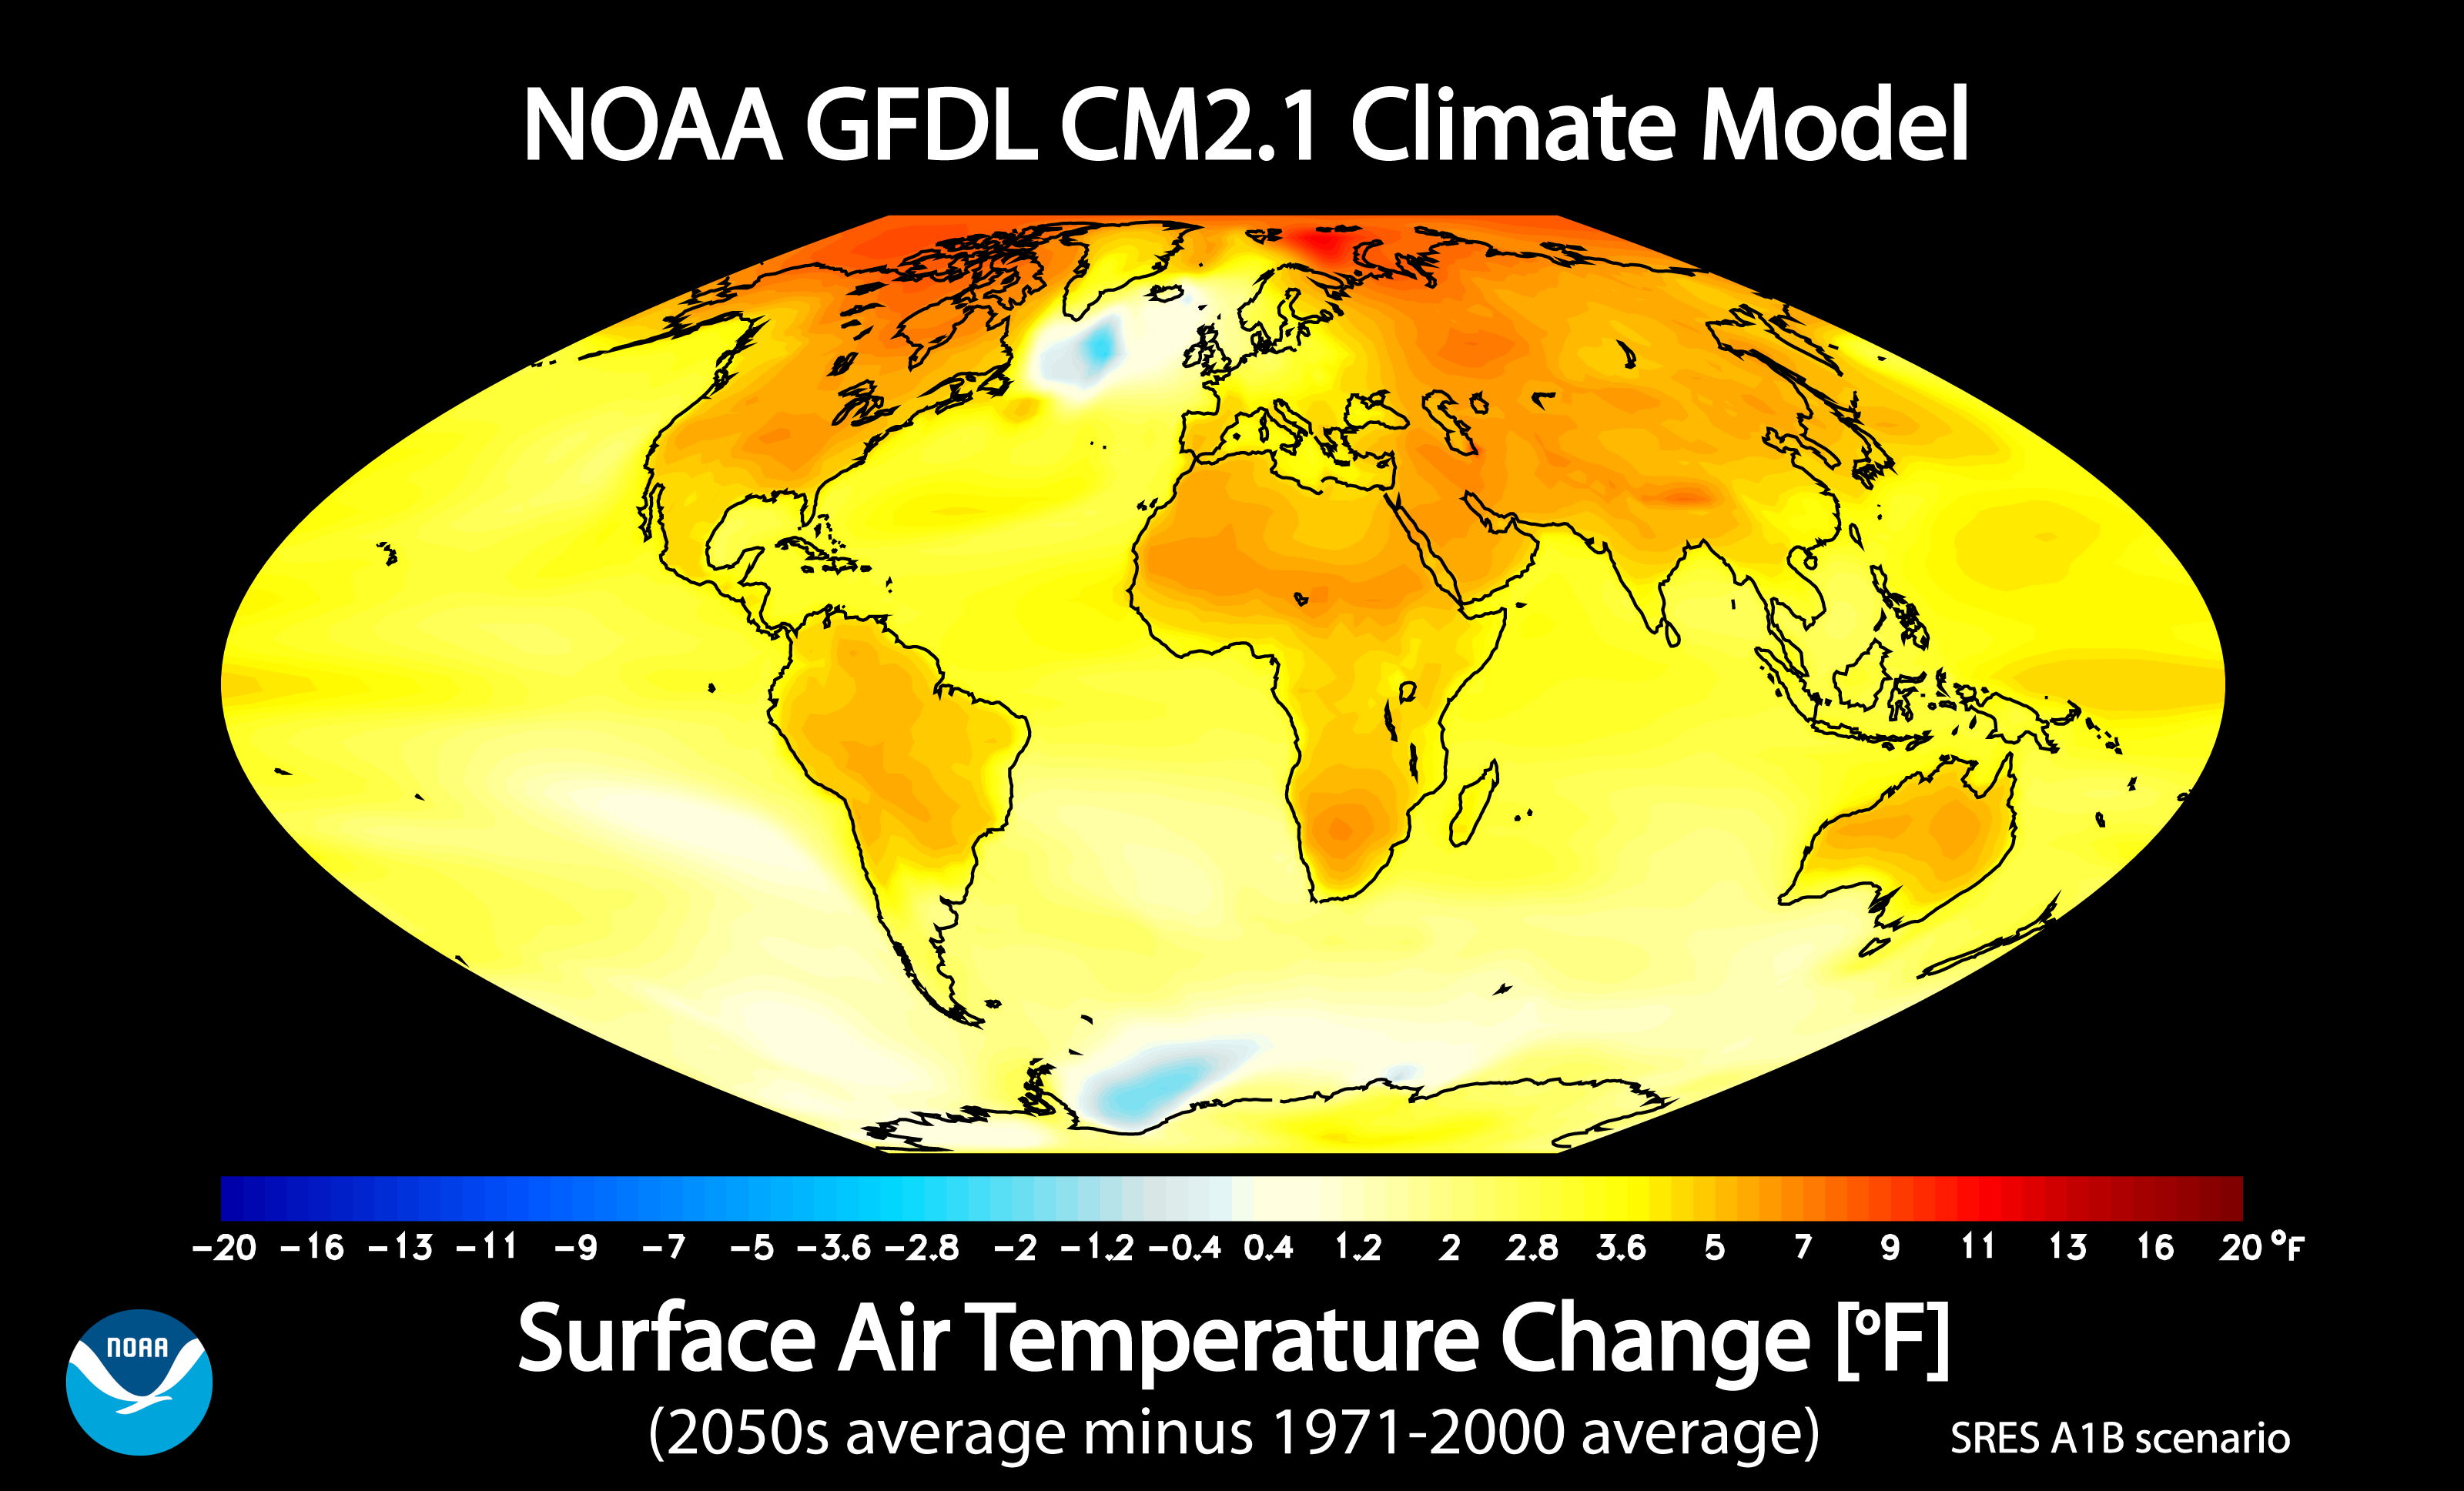
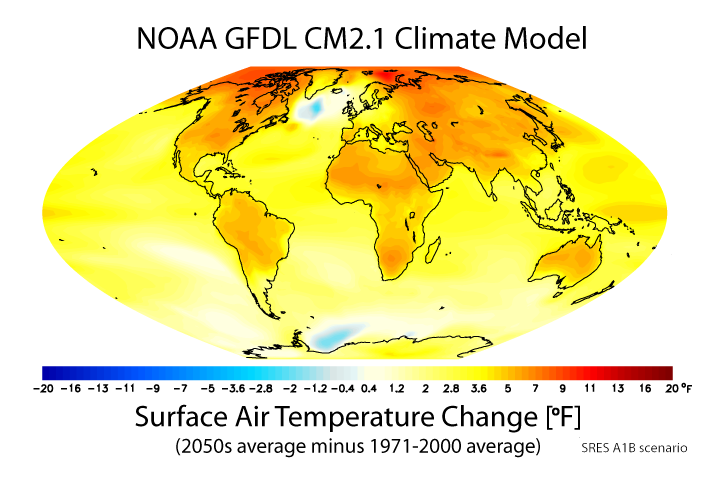
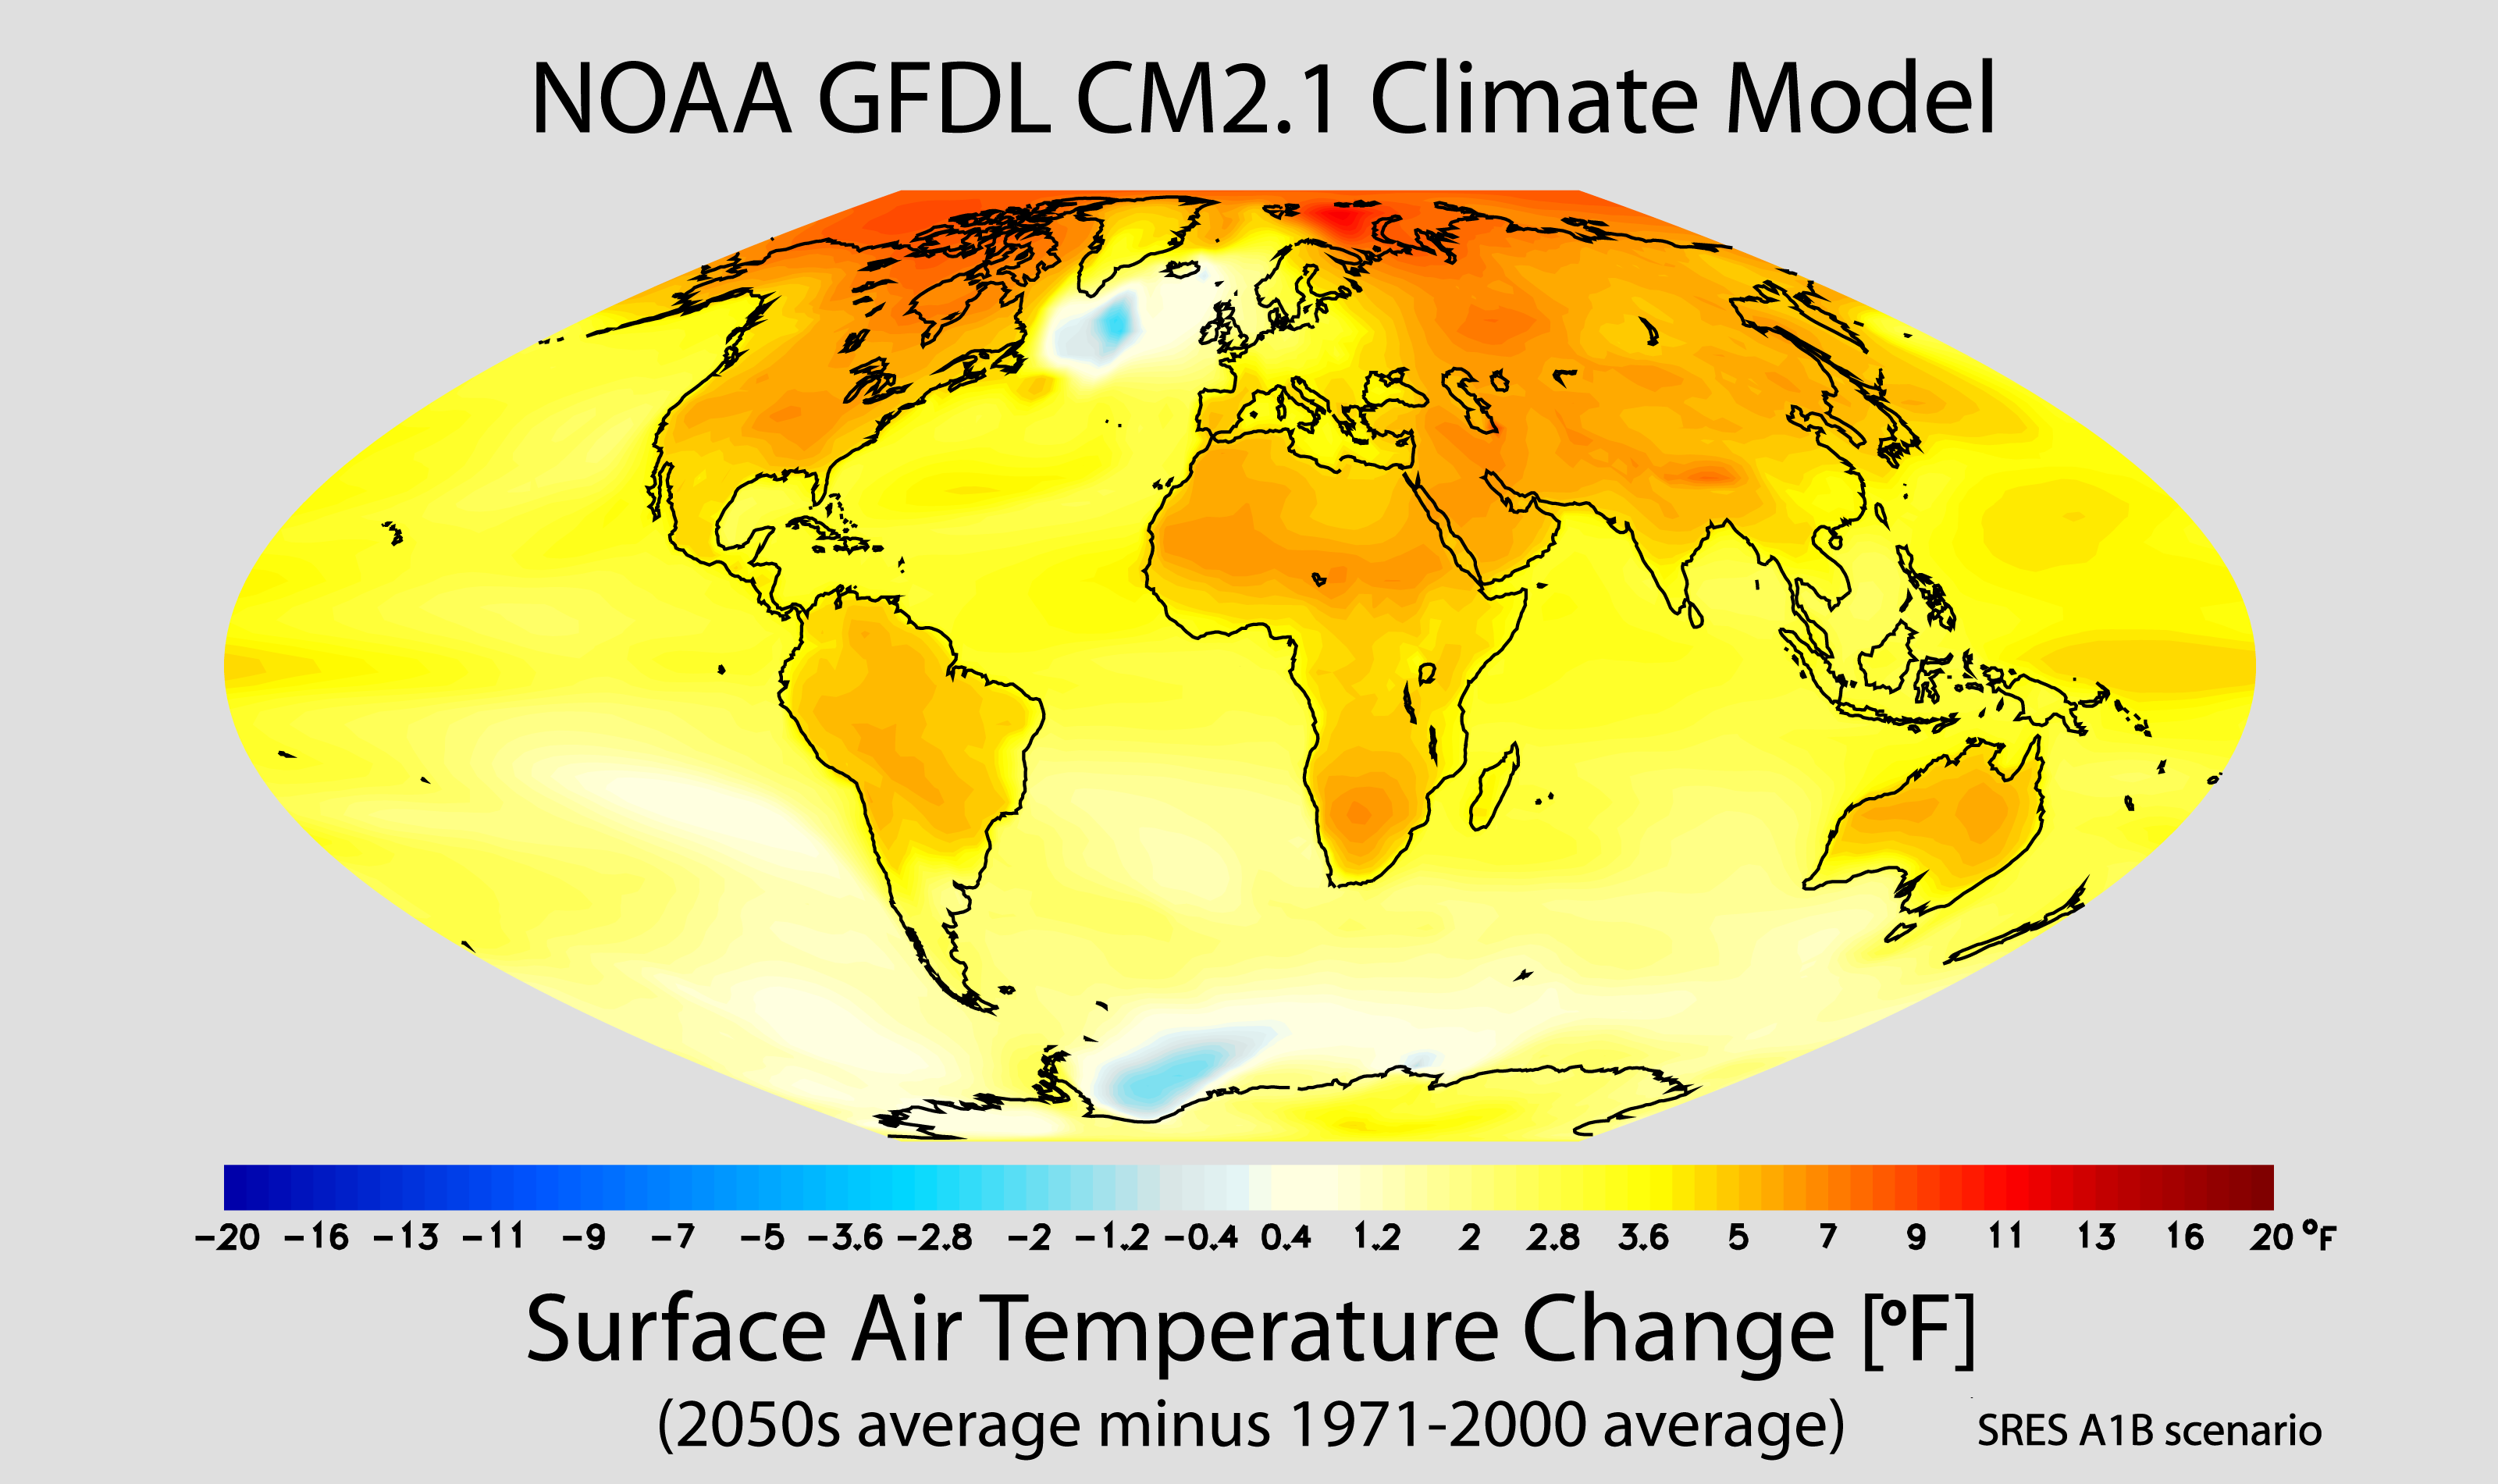
NOAA/GFDL CM2.1 Climate Model
Projected change in annual mean surface air temperature from the late 20th century (1971-2000 average) to the middle 21st century (2051-2060 average).
Details
Title |
NOAA/GFDL CM2.1 Climate Model |
Description |
Projected change in annual mean surface air temperature from the late 20th century (1971-2000 average) to the middle 21st century (2051-2060 average). The change is in response to increasing greenhouse gases and aerosols based on a “middle of the road” estimate of future emissions. This scenario is denoted as IPCC SRES A1B. Warming is larger over continents than oceans, and is largest at high latitudes of the Northern Hemisphere. These results are from the GFDL CM2.1 model, but are consistent with a broad consensus of modeling results. Additional information on this topic, including a two page PDF summary, can be found on our Climate Research Highlights: Patterns of Greenhouse Warming web page. |
Model name |
CM2.1 Climate Model |
Scientist(s) |
Thomas Delworth, Ronald Stouffer, Michael Winton |
Date Created |
|
Visualization personnel |
Keith Dixon |
Files |
PNG – 1920×1163 Black Background PNG – 3200×1937 Black Background PNG – 720×480 White Background PNG – 3200×1901 White Background |
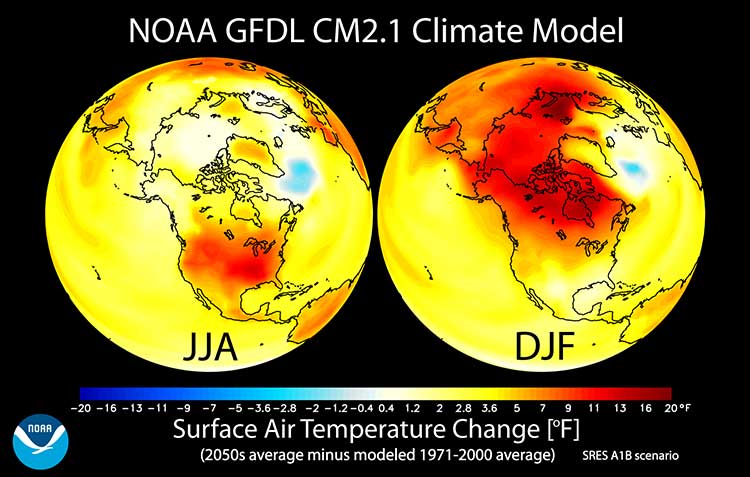
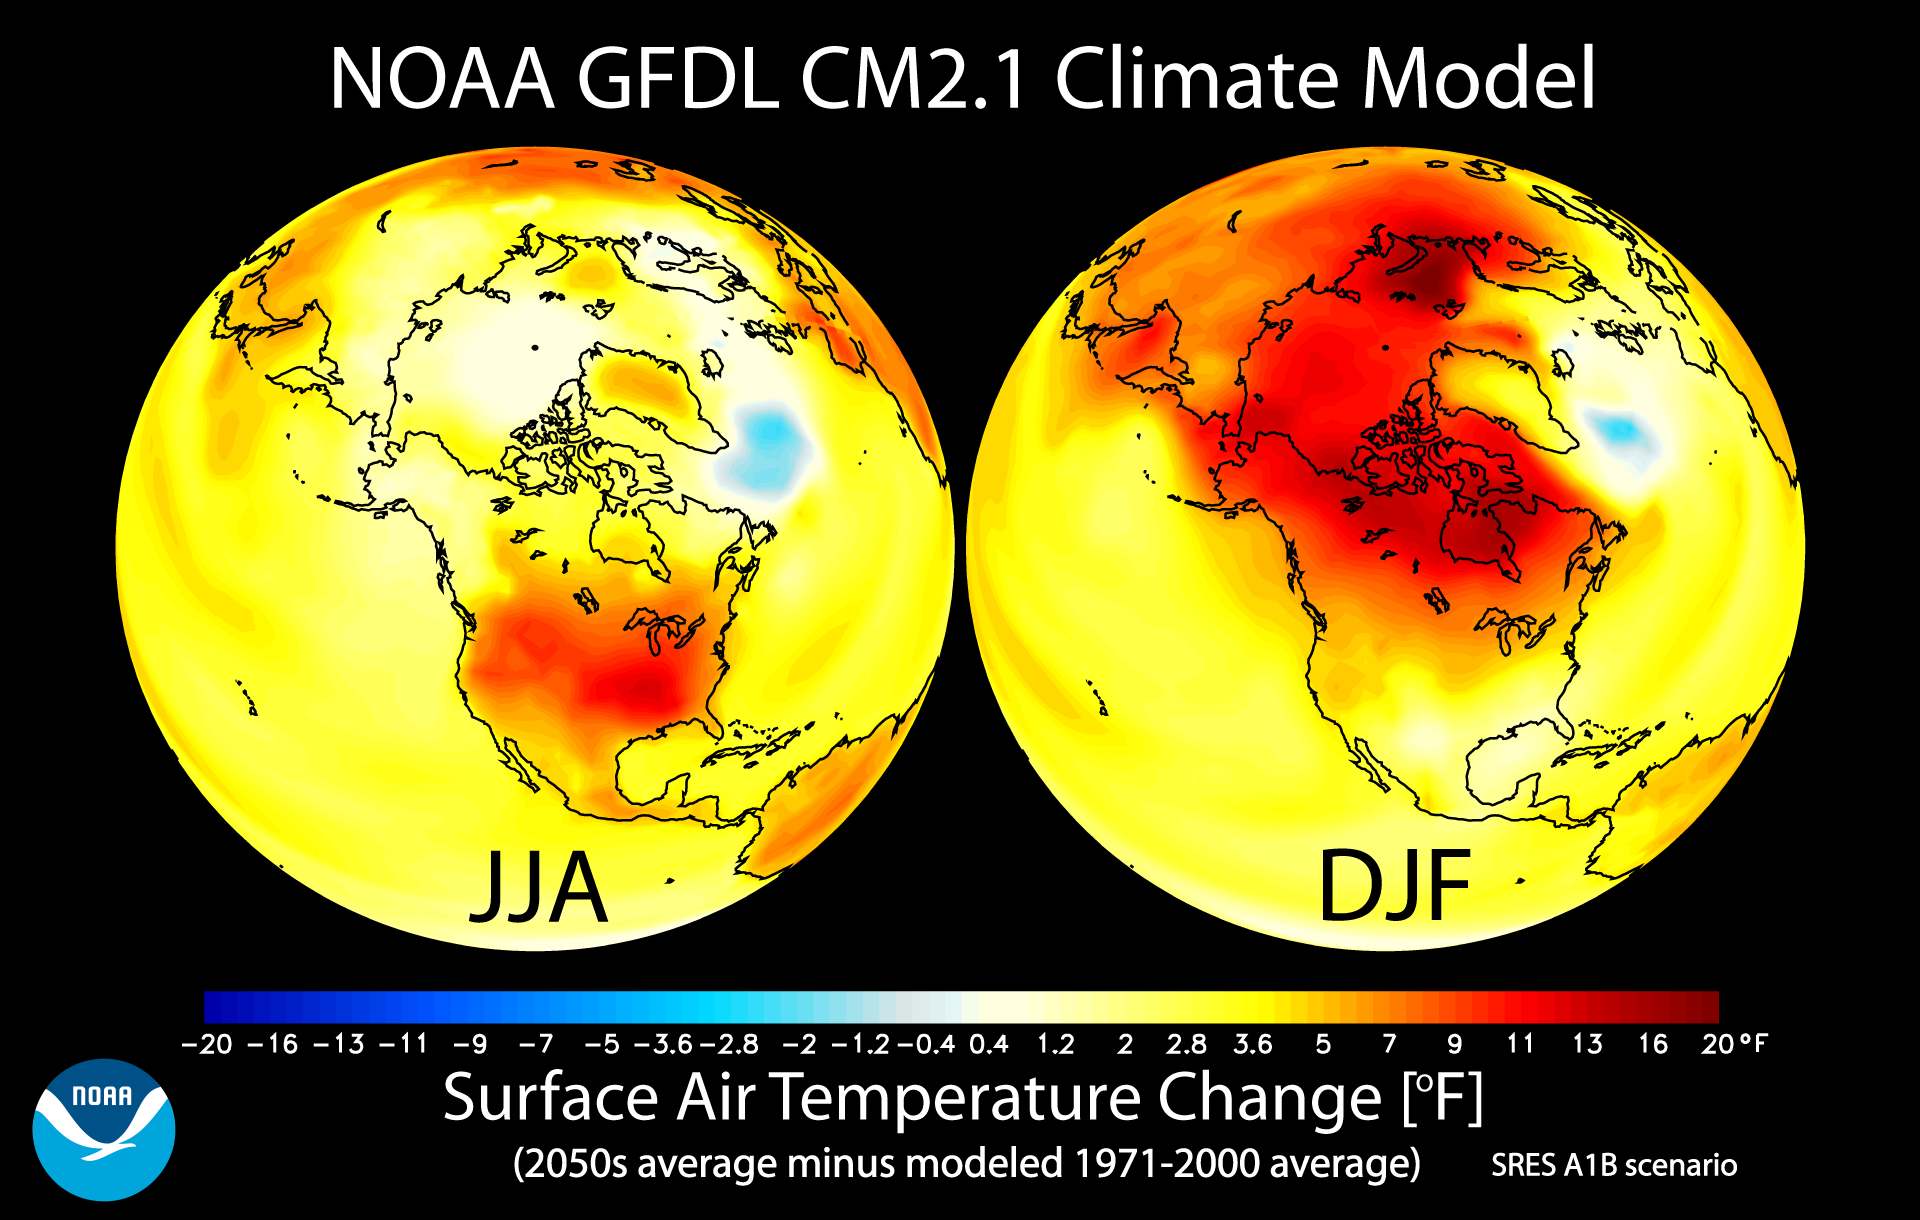
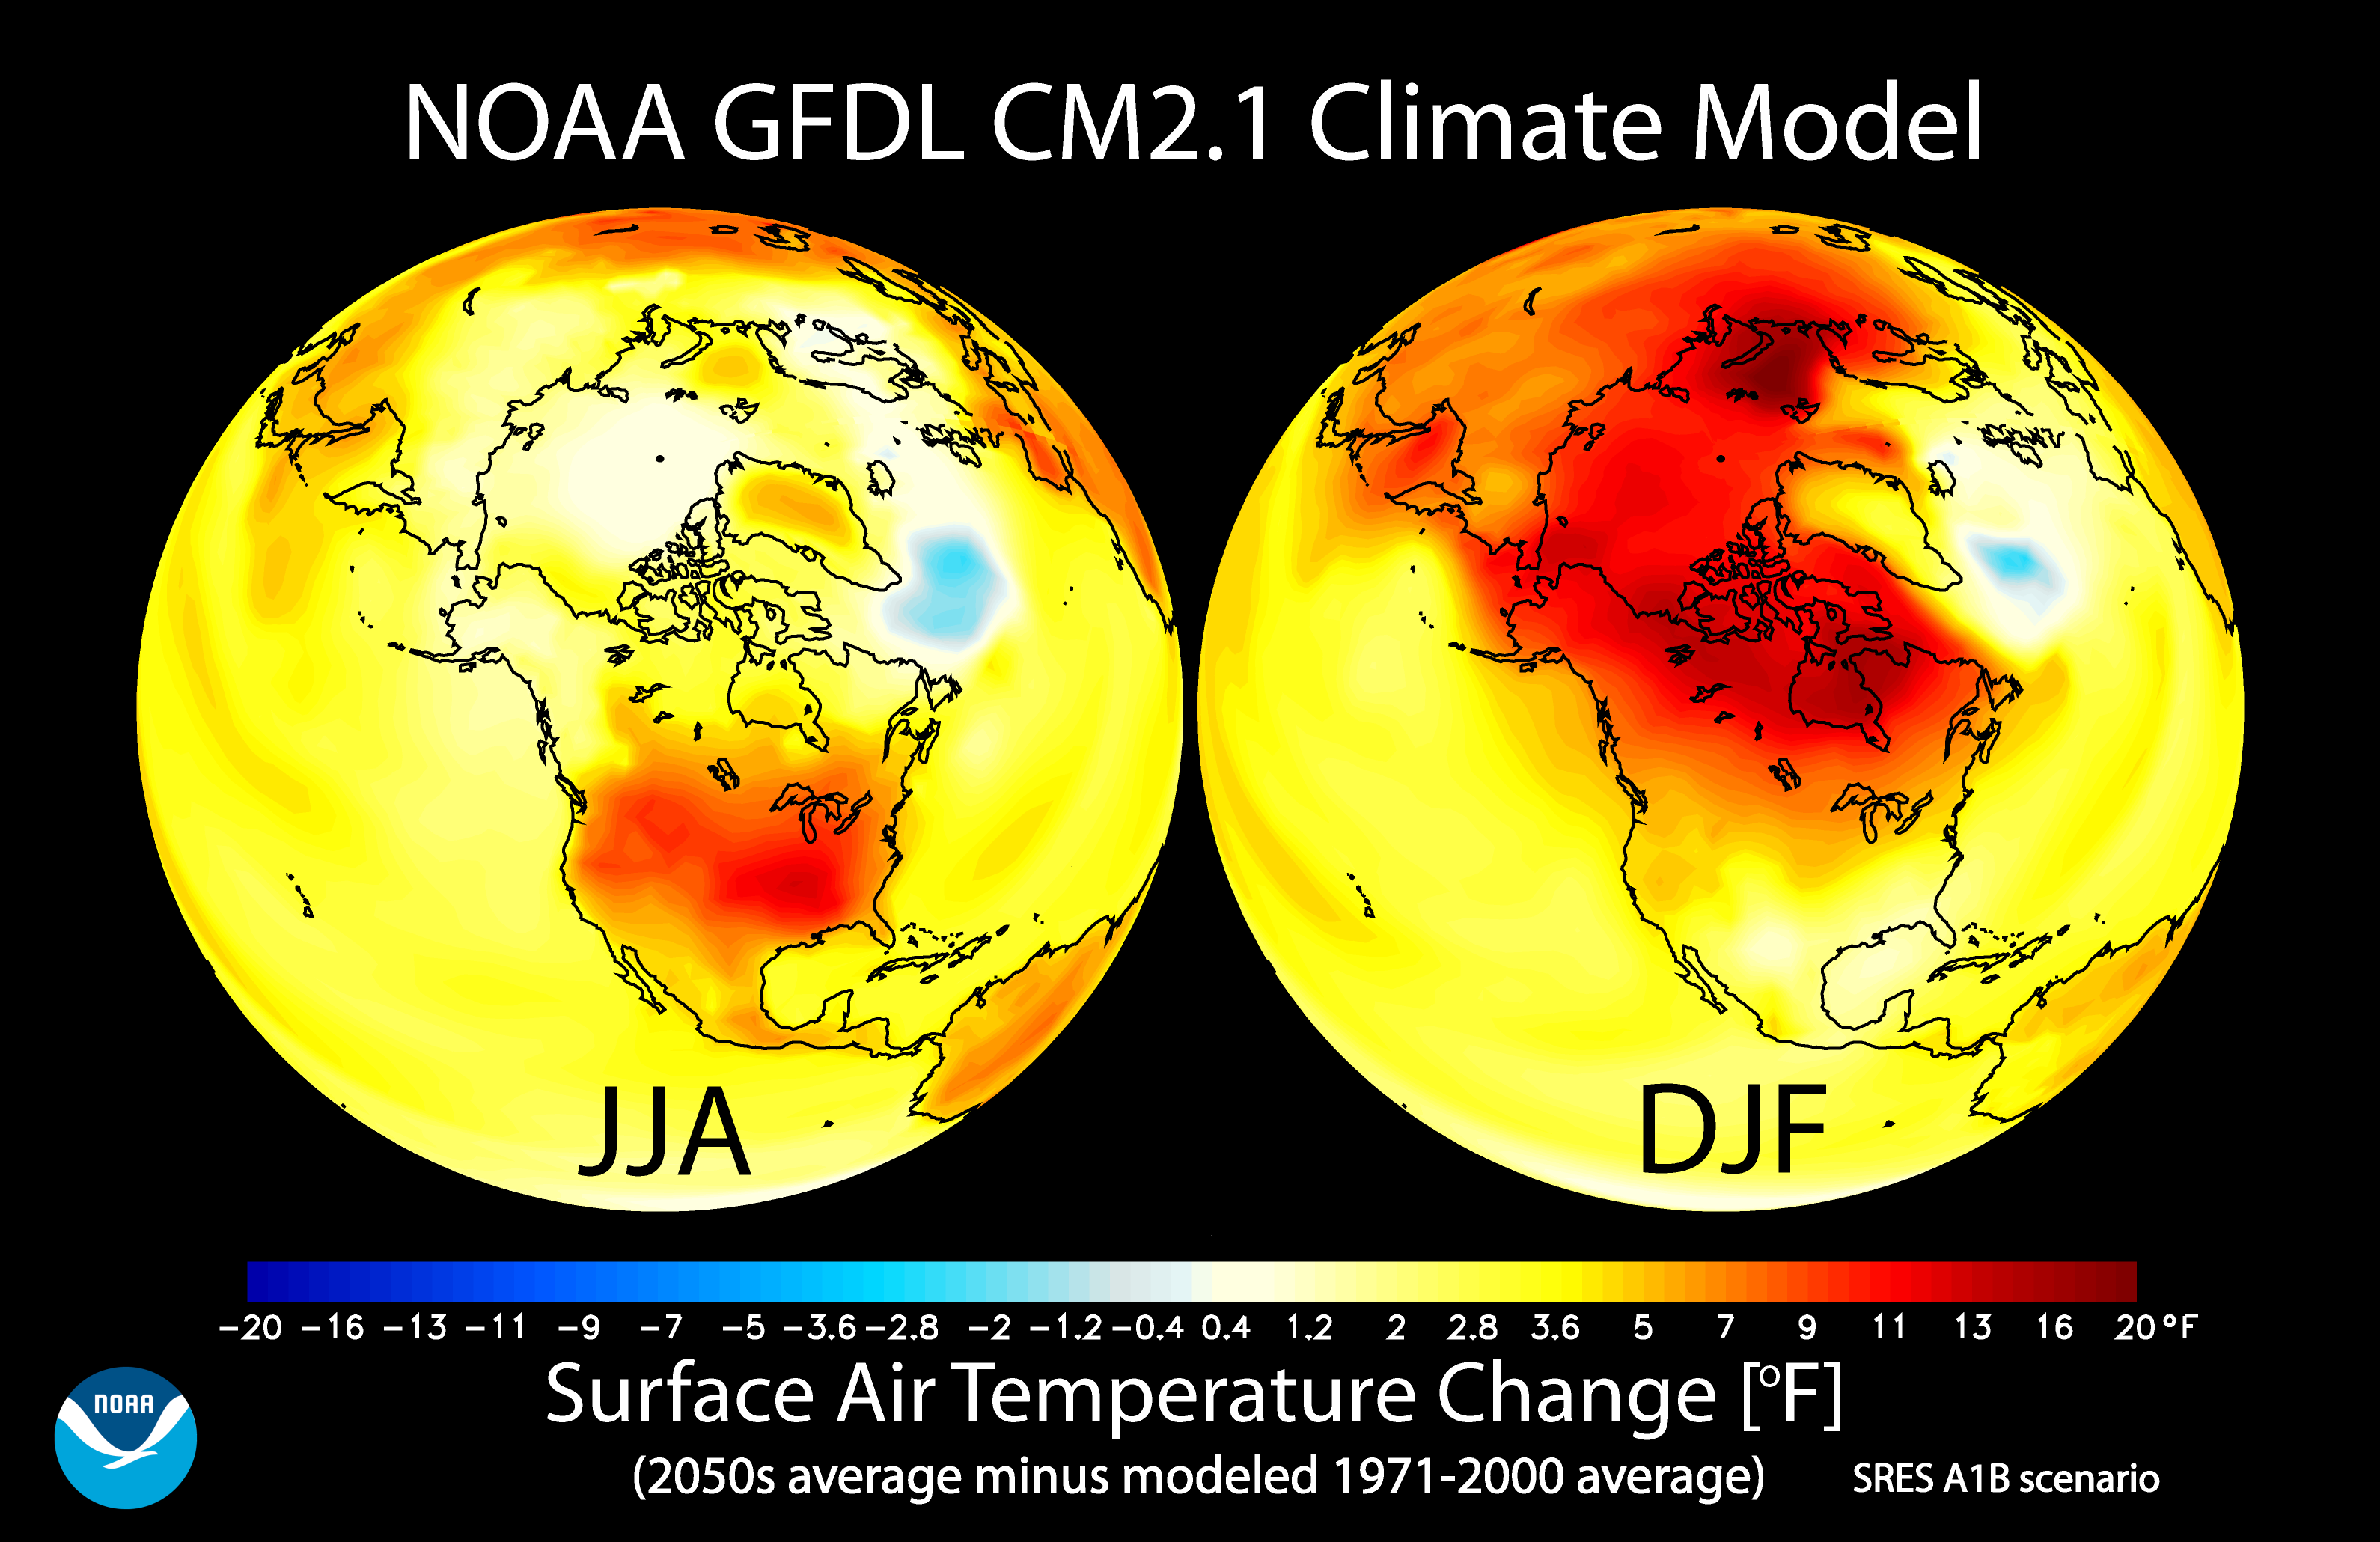
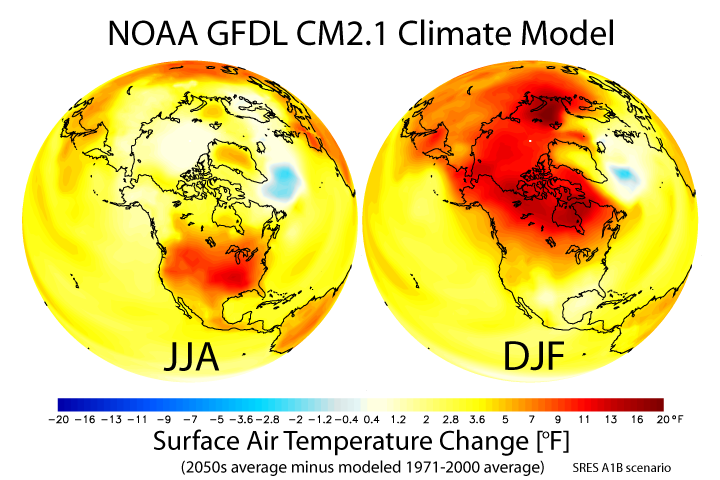
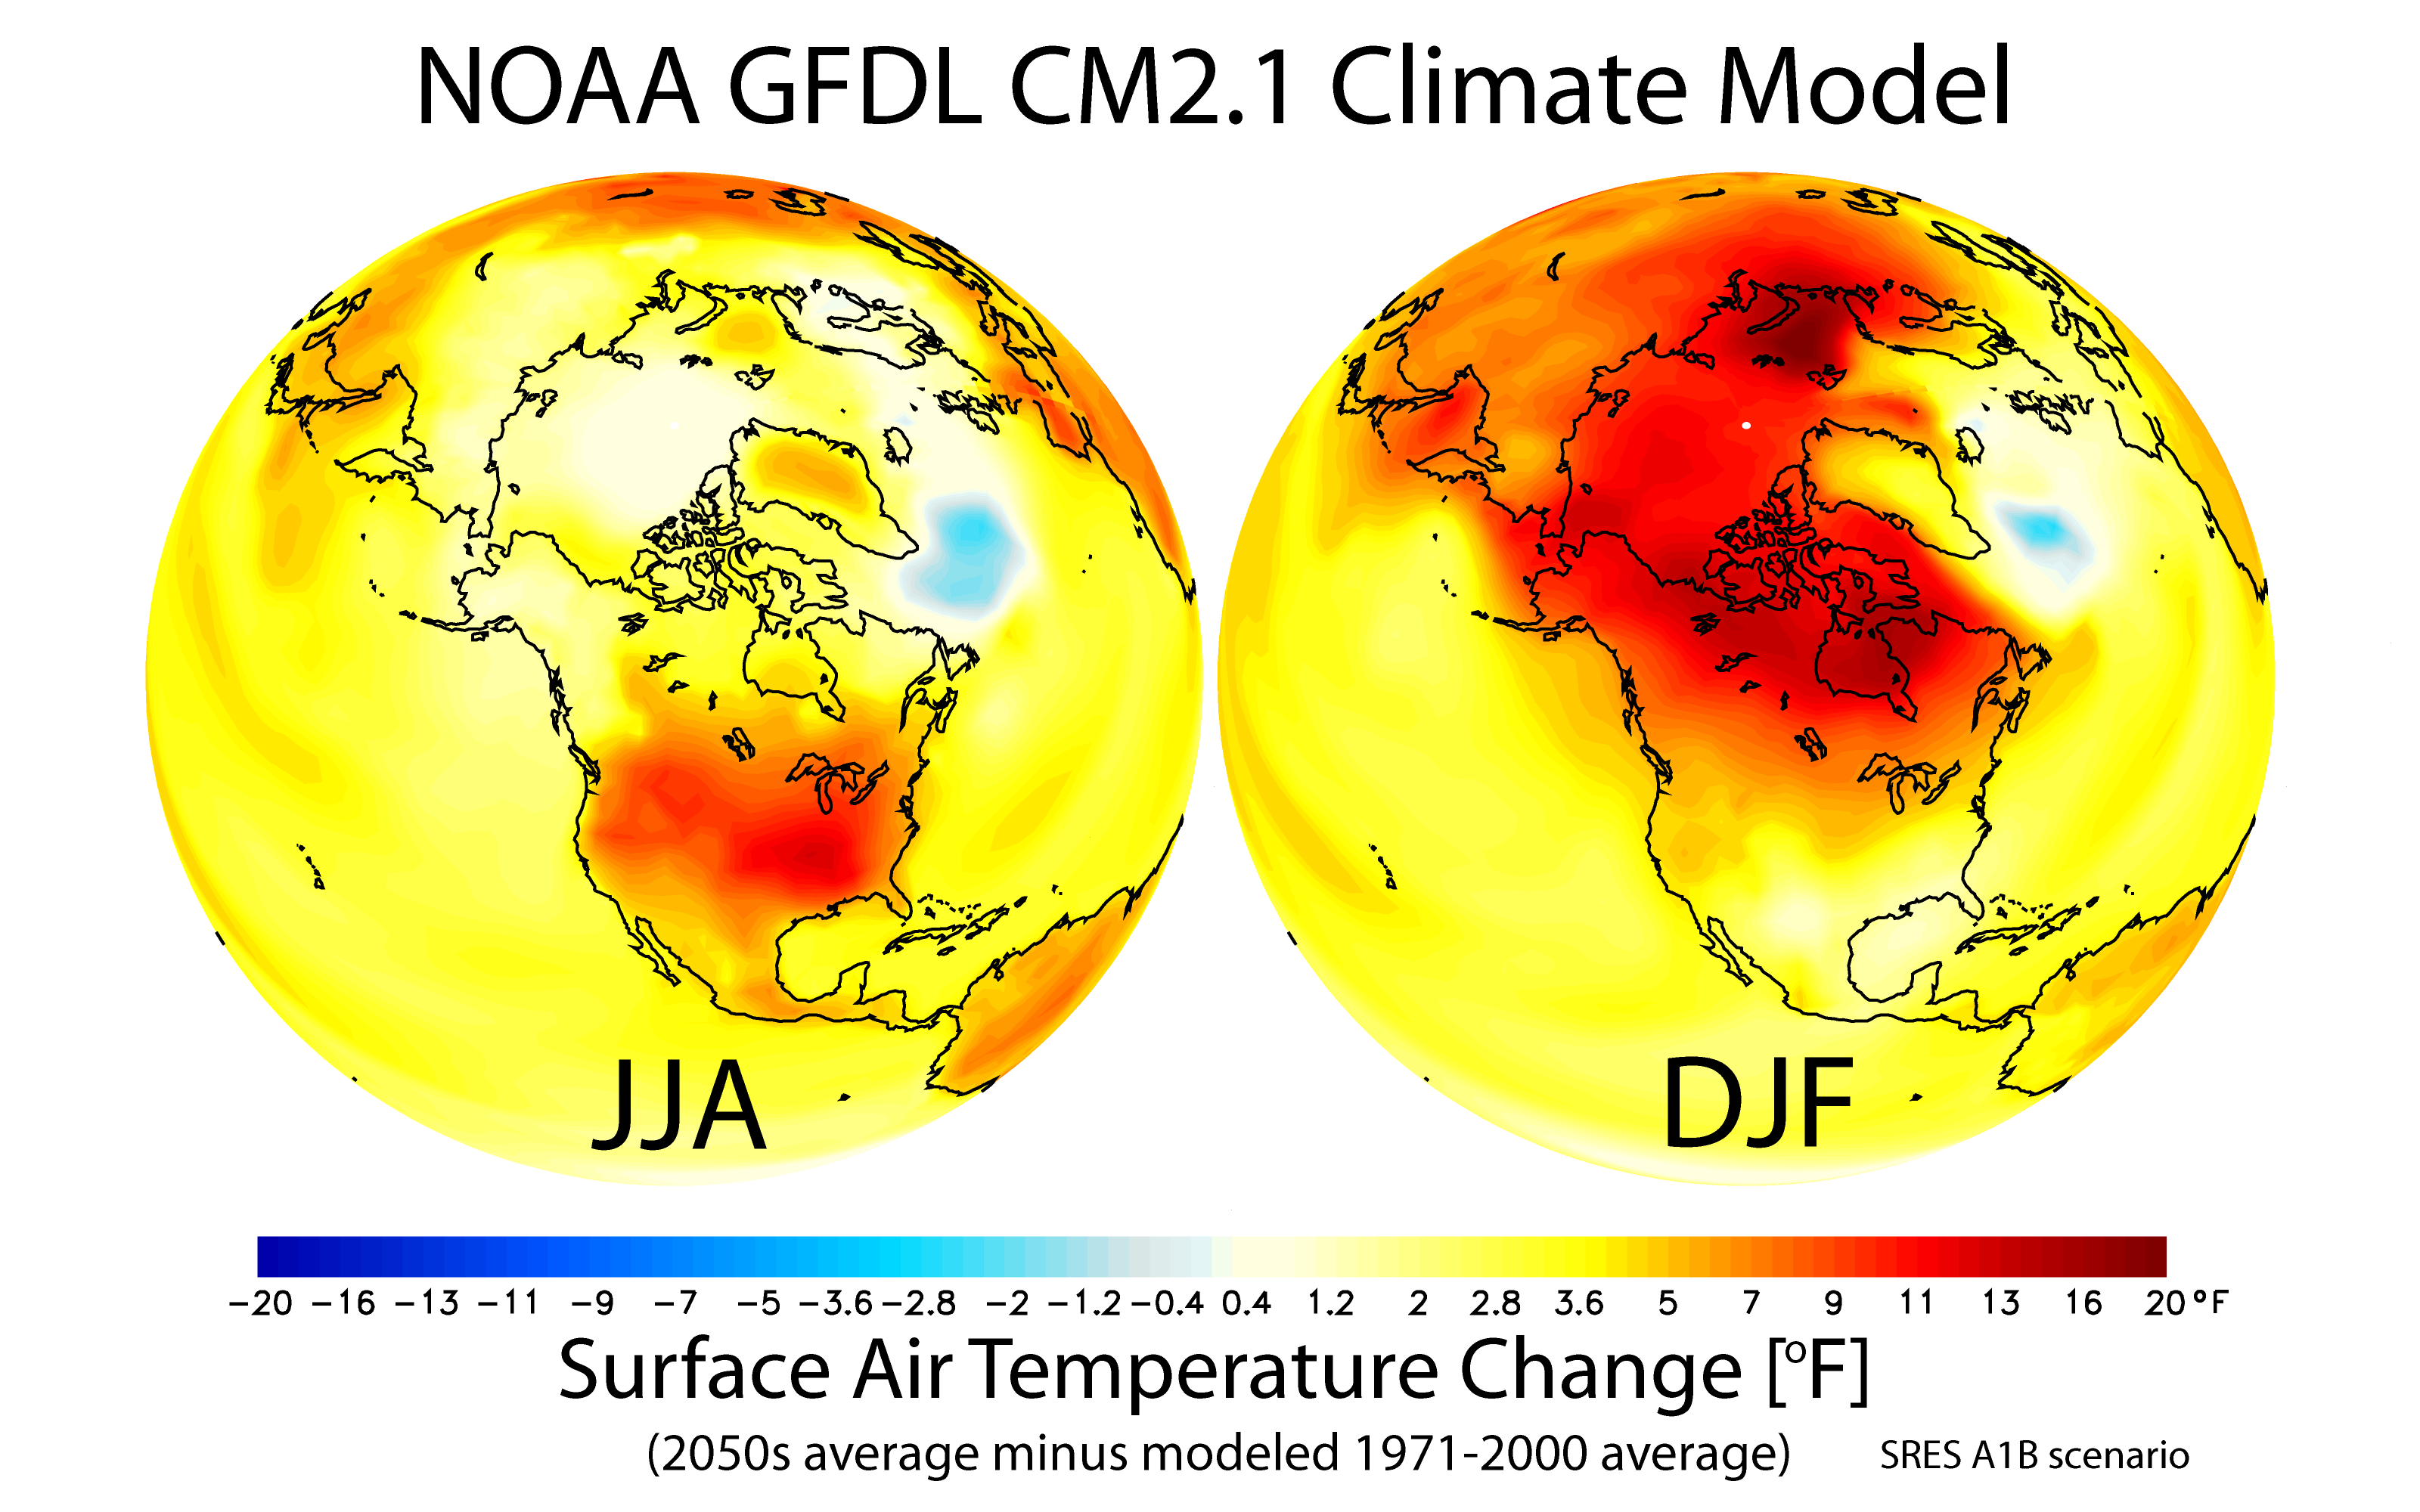
NOAA/GFDL CM2.1 Climate Model
GFDL CM2.1 model-simulated change in seasonal mean surface air temperature from the late 20th century (1971-2000 average) to the middle 21st century (2051-2060).
Details
Title |
NOAA/GFDL CM2.1 Climate Model |
Description |
GFDL CM2.1 model-simulated change in seasonal mean surface air temperature from the late 20th century (1971-2000 average) to the middle 21st century (2051-2060). The left panel shows changes for June July August (JJA) seasonal averages, and the right panel shows changes for December January February (DJF). The simulated surface air temperature changes are in response to increasing greenhouse gases and aerosols based on a “middle of the road” estimate of future emissions This scenario is denoted as IPCC SRES A1B. Warming is projected to be larger over continents than oceans, and is largest at high latitudes of the Northern Hemisphere during Northern Hemisphere winter (DJF). Additional information on this topic, including a two page PDF summary, can be found on our Climate Research Highlights: Patterns of Greenhouse Warming web page. |
Model name |
CM2.1 Climate Model |
Scientist(s) |
Thomas Delworth, Ronald Stouffer, Michael Winton |
Date Created |
|
Visualization personnel |
Keith Dixon |
Files |
PNG – 1920×1220 Black Background PNG – 3180×2060 Black Background PNG – 720×480 White Background PNG – 3200×2000 White Background |
NOAA/GFDL CM2.1 Climate Model
This animation depicts the time evolution of annual mean surface air temperature changes as projected by the NOAA GFDL CM2.1 climate model. The animations show the time period 1970 to 2100.
Details
Title |
NOAA/GFDL CM2.1 Climate Model |
Description |
This animation depicts the time evolution of annual mean surface air temperature changes as projected by the NOAA GFDL CM2.1 climate model. The animations show the time period 1970 to 2100. For each time level shown, the temperature differences (or anomalies) were calculated by subtracting the model-simulated average for the years 1971 to 2000 from the time varying 21st century model-projected temperatures. The changes depicted in the animation are in response to increasing greenhouse gases and aerosols based on a “middle of the road” estimate of future emissions. This scenario is denoted as IPCC SRES A1B.These animations were produced using the output of the CM2.1 “H2” historical experiment for the 20th century time period and the CM2.1 SRES A1B run for the 2001-2100 period. Additional information on this topic, including a two page PDF summary, can be found on our Climate Research Highlights: Patterns of Greenhouse Warming web page. |
Model name |
CM2.1 Climate Model |
Scientist(s) |
Thomas Delworth, Ronald Stouffer, Michael Winton |
Date Created |
|
Visualization personnel |
Keith Dixon |
Files |
720×480 MOV (13MB) 720×480 AVI (12MB) 1280×720 MOV (27MB) 1280×720 AVI (17MB) |
Ozone Decline and Recovery
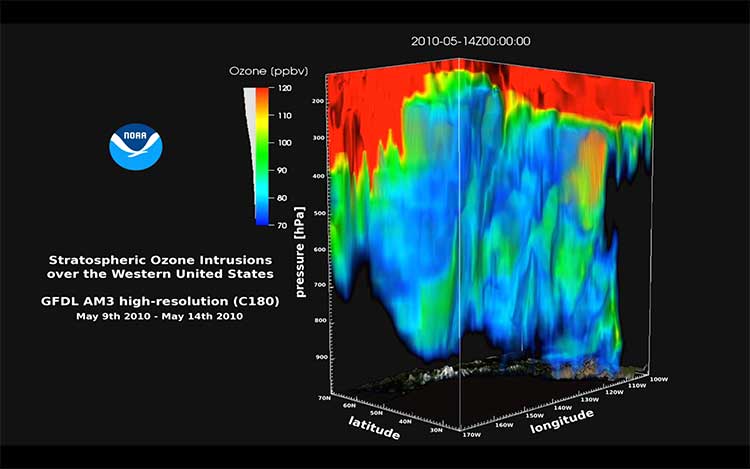
Stratosphere-troposphere transport of ozone in NOAA/GFDL AM3 c180 model
Stratosphere-to-troposphere transport of ozone as simulated in the high-resolution (~50×50 km2), full chemistry GFDL AM3 model. The animation illustrates the 3-hourly progression of a deep stratospheric ozone intrusion with a tropopause fold occurring over…
Details
Title |
Stratosphere-troposphere transport of ozone in NOAA/GFDL AM3 c180 model |
Description |
Stratosphere-to-troposphere transport of ozone as simulated in the high-resolution (~50×50 km2), full chemistry GFDL AM3 model. The animation illustrates the 3-hourly progression of a deep stratospheric ozone intrusion with a tropopause fold occurring over the Northeast Pacific Ocean during the CalNex field campaign in May 2010, followed by its break away from the main polar vortex and southeastward transport of injected stratospheric ozone to the western U.S. lower troposphere. |
Model name |
AM3 c180L48 chemistry-climate model |
Scientist(s) |
Meiyun Lin, Arlene Fiore, Larry Horowitz |
Date Created |
2011 |
Visualization personnel |
|
Files |
1280×720 MOV (20MB) |
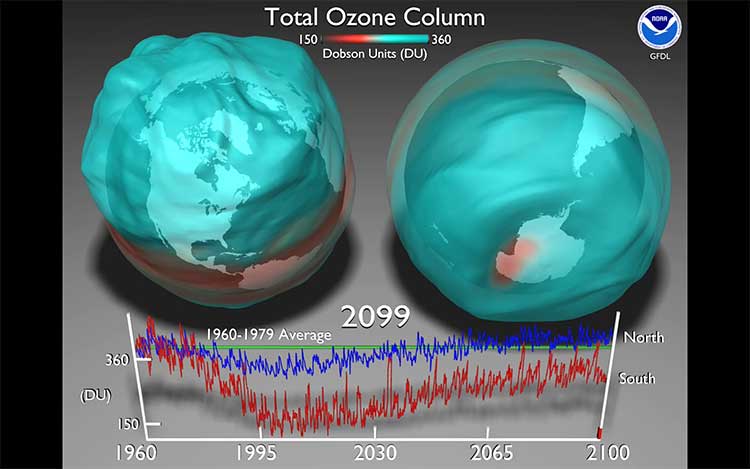
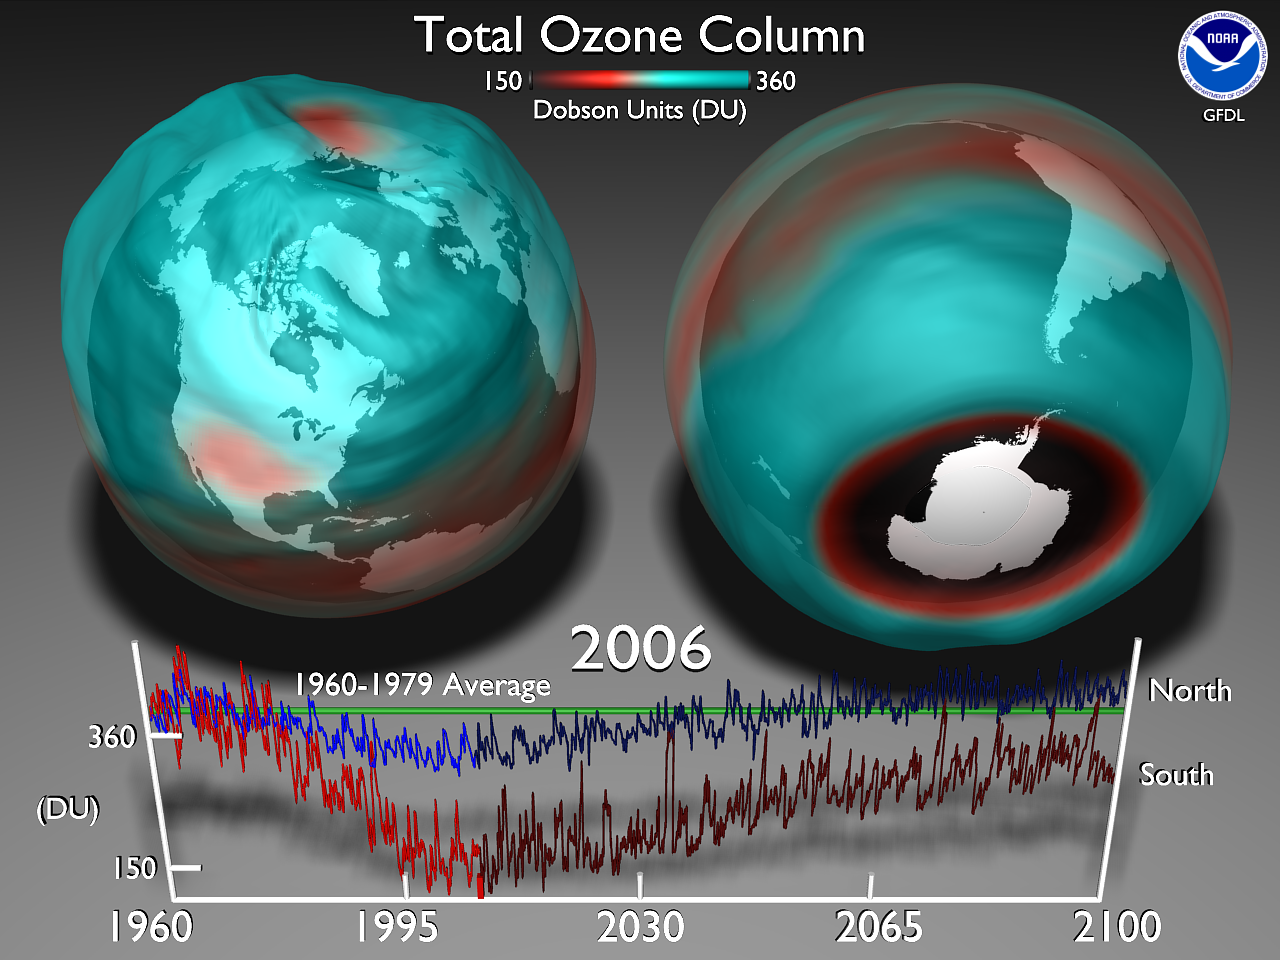
Total Ozone Column
The animation shows the evolution of northern and southern hemisphere ozone as simulated in the GFDL coupled chemistry-climate model. The animation covers the period 1960 to 2100 and shows the development and disappearance of the Antarctic ozone hole.
Details
Title |
Total Ozone Column |
Description |
The animation shows the evolution of northern and southern hemisphere ozone as simulated in the GFDL coupled chemistry-climate model. The animation covers the period 1960 to 2100 and shows the development and disappearance of the Antarctic ozone hole. |
Model name |
|
Scientist(s) |
John Austin |
Date Created |
August 2007 |
Visualization personnel |
|
Files |
1280×960 MPG (140MB) 1280×960 MOV (167MB) 640×480 MPG (65MB) 640×480 MOV (66MB) PNG (755KB) |
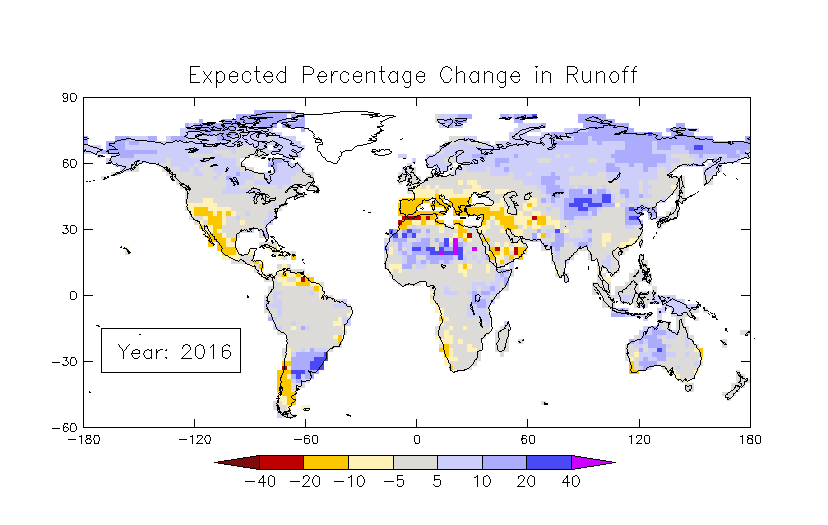
Water Flow
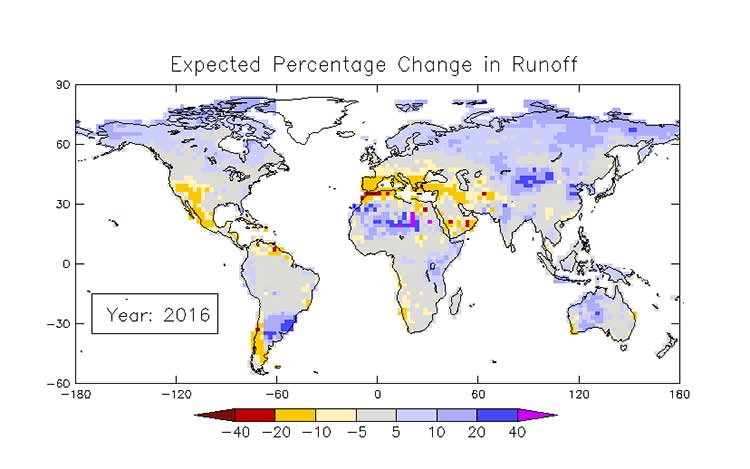
Projected percentage changes in runoff, 21st century
This is an animation of a multi-model estimate of the expected value of runoff change (relative to the historical period 1900-1970) under the SRES A1B emissions scenario.
Details
Title |
Projected percentage changes in runoff, 21st century |
Description |
This is an animation of a multi-model estimate of the expected value of runoff change (relative to the historical period 1900-1970) under the SRES A1B emissions scenario. The “flickering” of colors back and forth is mainly an artifact of the way the data have been processed–internal variability of the climate system has not entirely been removed. The actual estimate of the signal of changing climate is seen in the gradual shift in colors from light to dark. It should be kept in mind that the future will have both a climate-change signal and internal variability; the latter will be capable of causing large departures from “climatic normal” or expected conditions in any given year. |
Model name |
An ensemble of 12 climate models participating in the 3rd Phase of the Coupled Model Intercomparison Project. |
Scientist(s) |
P.C.D. Milly (USGS), K.A. Dunne |
Date Created |
July 2009 |
Visualization personnel |
P.C.D. Milly (USGS), K.A. Dunne |
Files |
GIF |
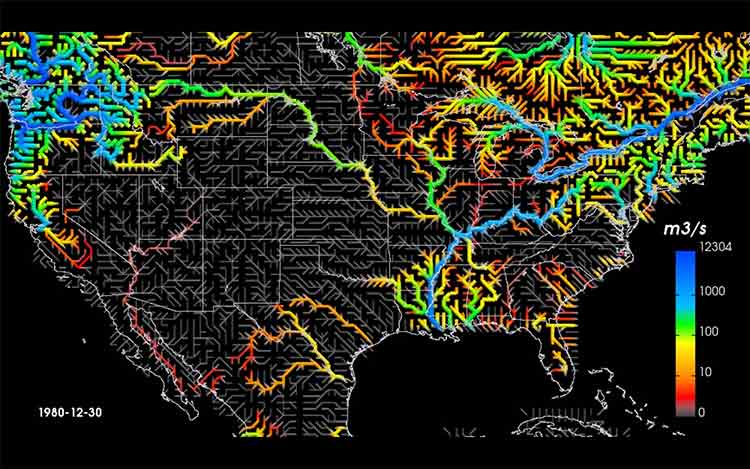
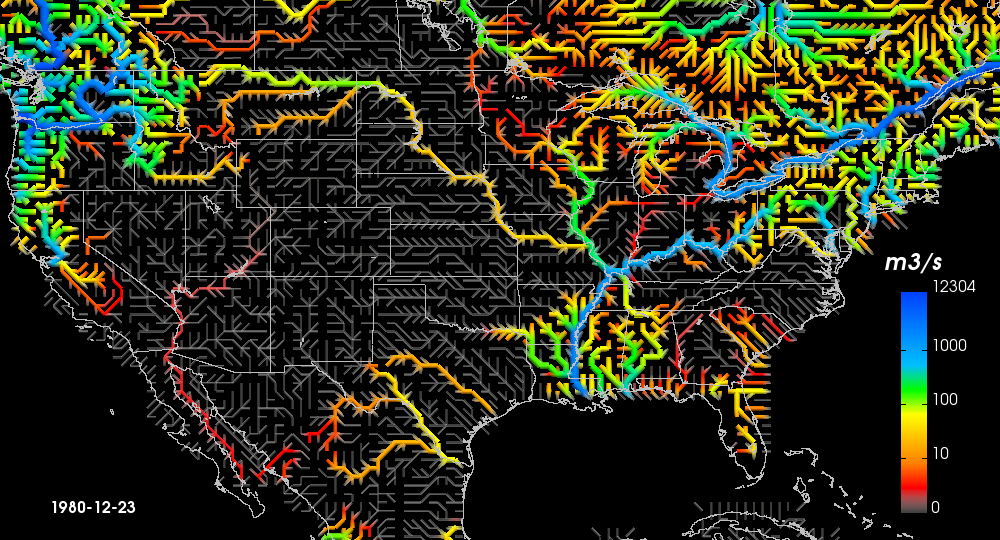
Water Flow
This animation depicts the flow of water through the river system of the United States. Color and width of line indicates volume of flow passing a given point per unit time.
Details
Title |
Water Flow |
Description |
This animation depicts the flow of water through the river system of the United States. Color and width of line indicates volume of flow passing a given point per unit time. The data were obtained from a two-year simulation of land water and energy balances, coupled to a network model of the river system. Because the model was started from a dry initial state, little flow is produced in the first year. Note the production of flow by spring snowmelt in the Rockies and the subsequent downstream flows. |
Model name |
Land Model (LM2) |
Scientist(s) |
Chris Milly (USGS) |
Date Created |
April 2005 |
Visualization personnel |
Remik Ziemlinski |
Files |
MPEG (20 MB) PNG (371 KB) |
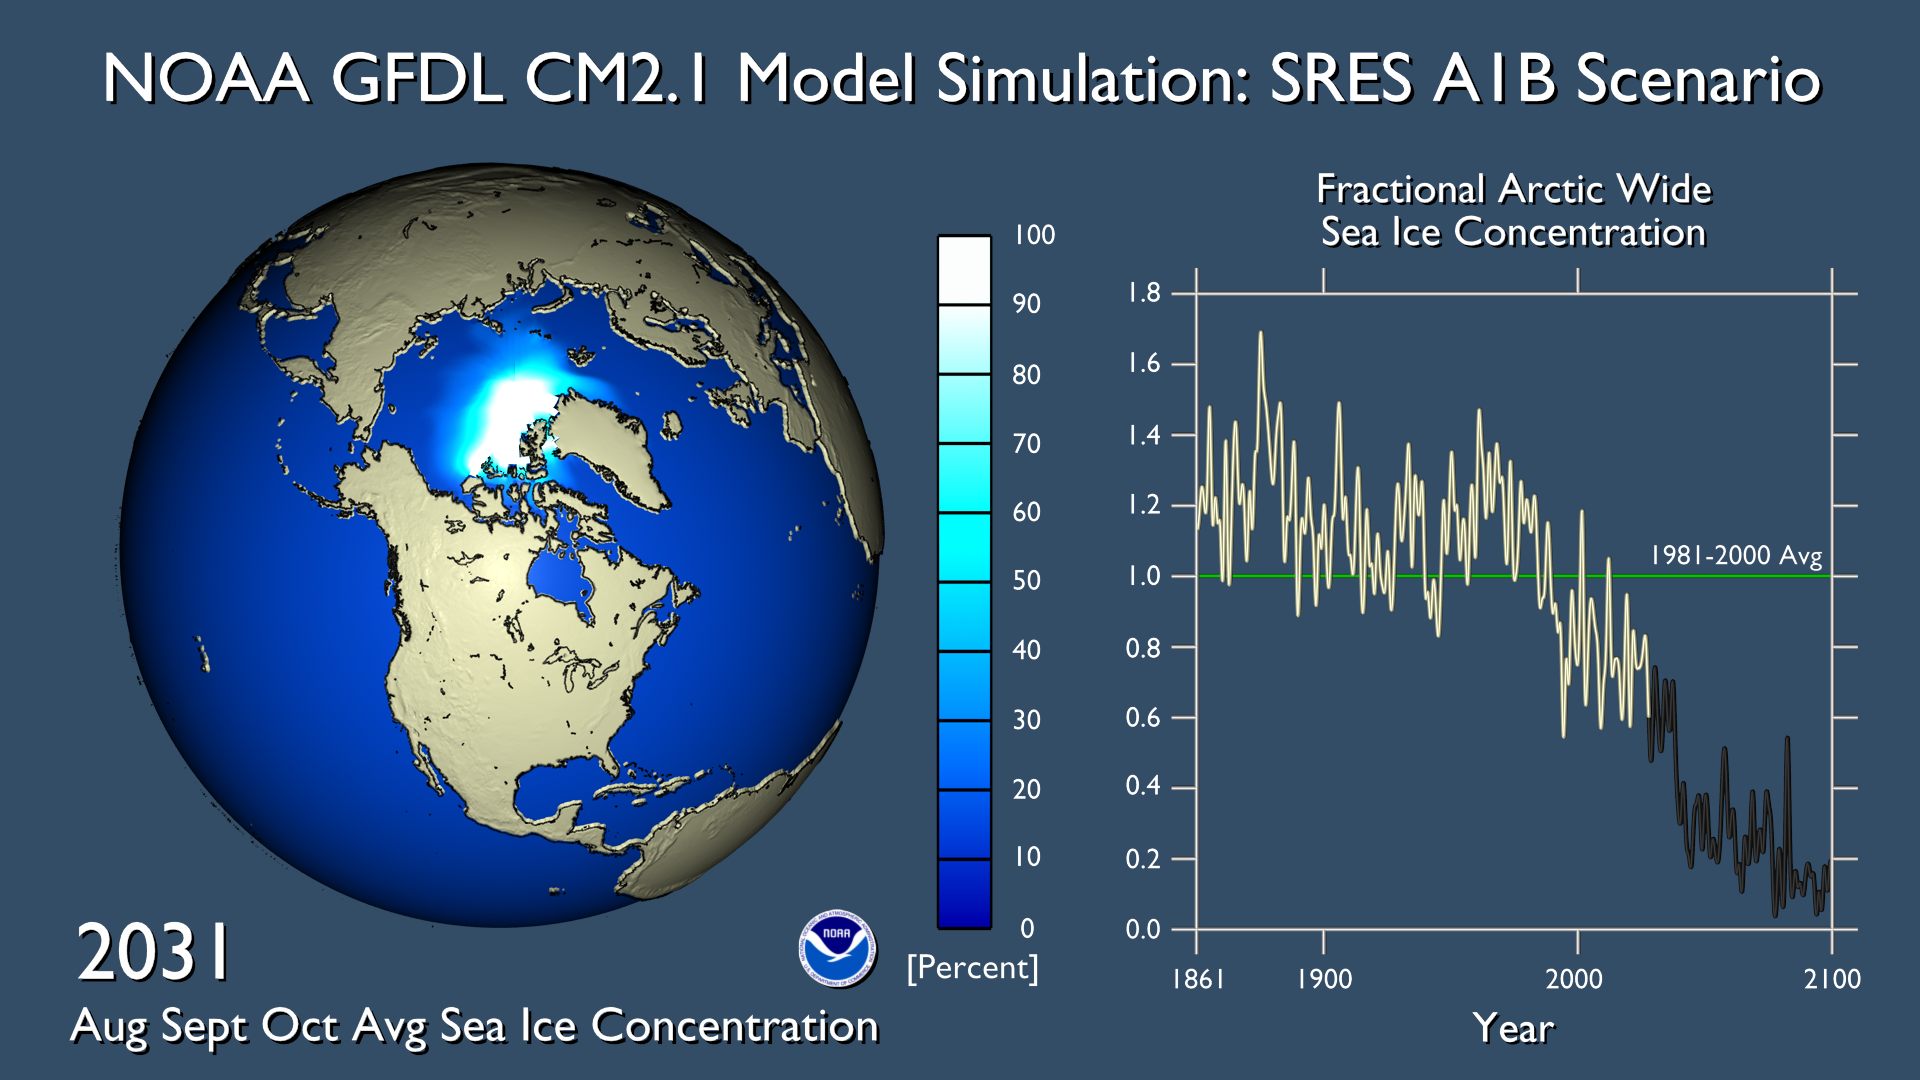
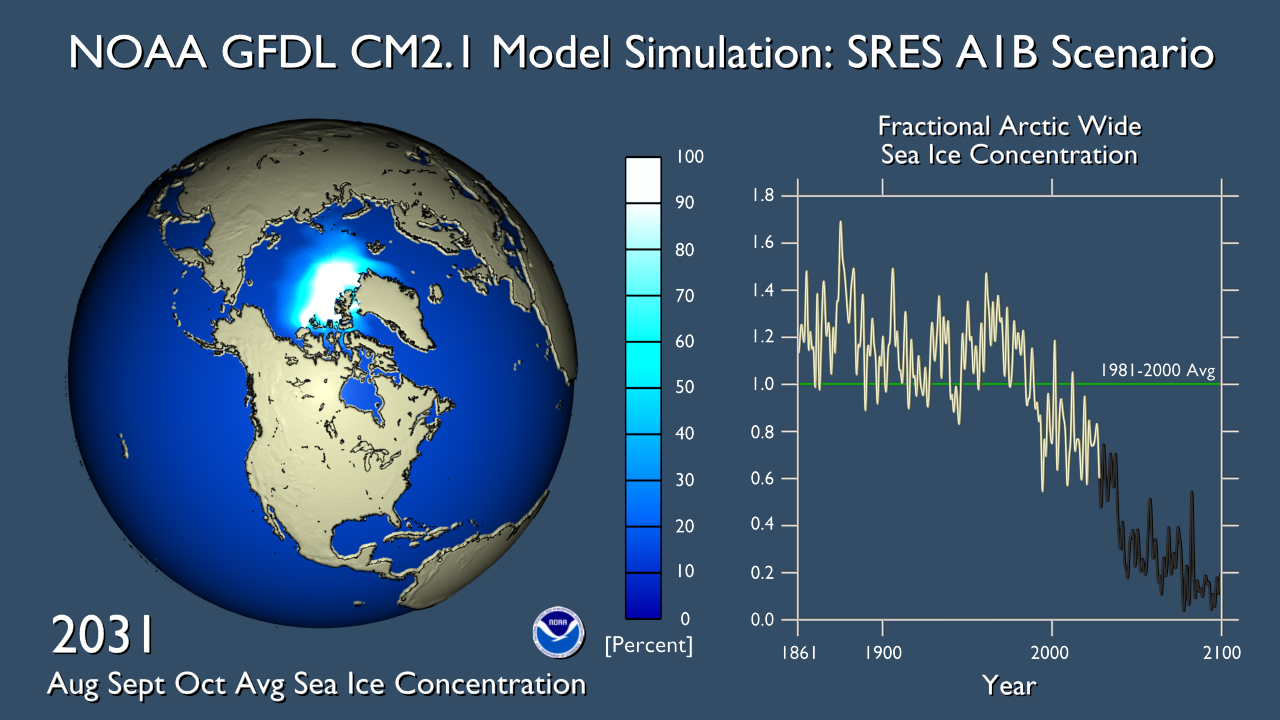
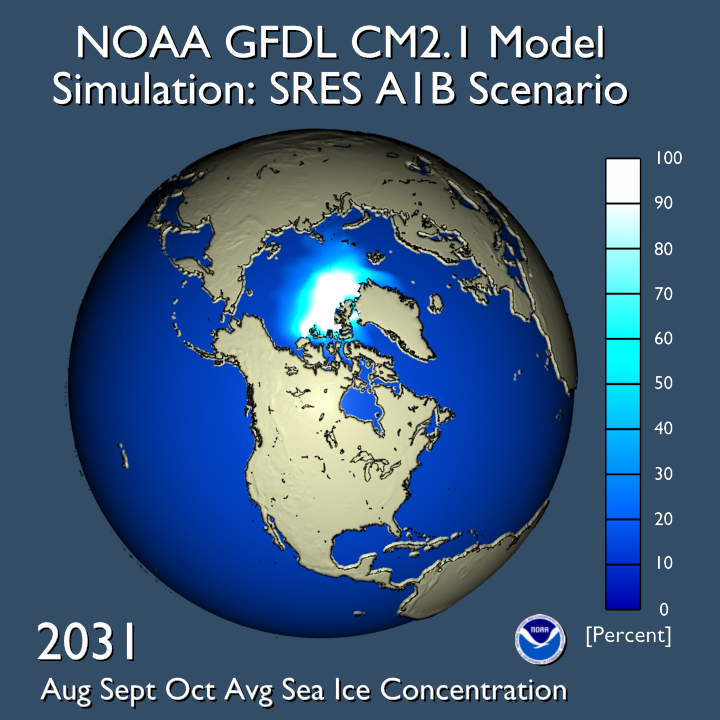
Arctic Sea Ice Changes
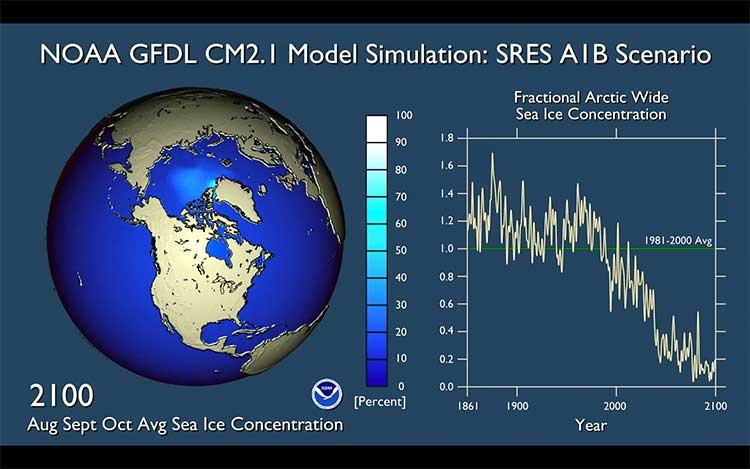
Arctic Sea Ice Changes
The future of Arctic sea-ice is a concern for various reasons and simulations with GFDL’s Coupled Model version 2.1 suggest a decline in sea-ice concentration, especially during the 21st century.
Details
Title |
Arctic Sea Ice Changes |
Description |
The future of Arctic sea-ice is a concern for various reasons and simulations with GFDL’s Coupled Model version 2.1 suggest a decline in sea-ice concentration, especially during the 21st century. Additional information on this topic, including a two page PDF summary, can be found on our Climate Research Highlights: The Shrinking Arctic Ice Cap web page. |
Model name |
GFDL CM2.1 |
Scientist(s) |
Michael Winton, Keith Dixon |
Date Created |
January 2007 |
Visualization personnel |
Remik Ziemlinksi |
Files |
PNG: 1920×1080 1280×720 720×720 MPEG: 1920×1080 1280×720 720×720 MOV: 1920×1080 1280×720 720×720 |
El Niño Forecasting
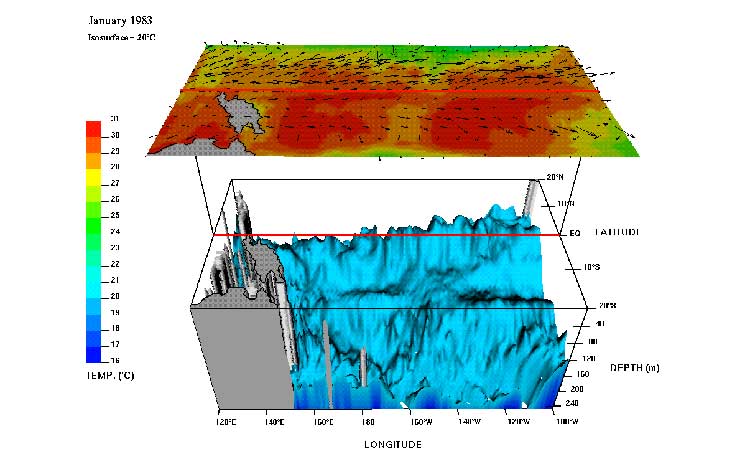
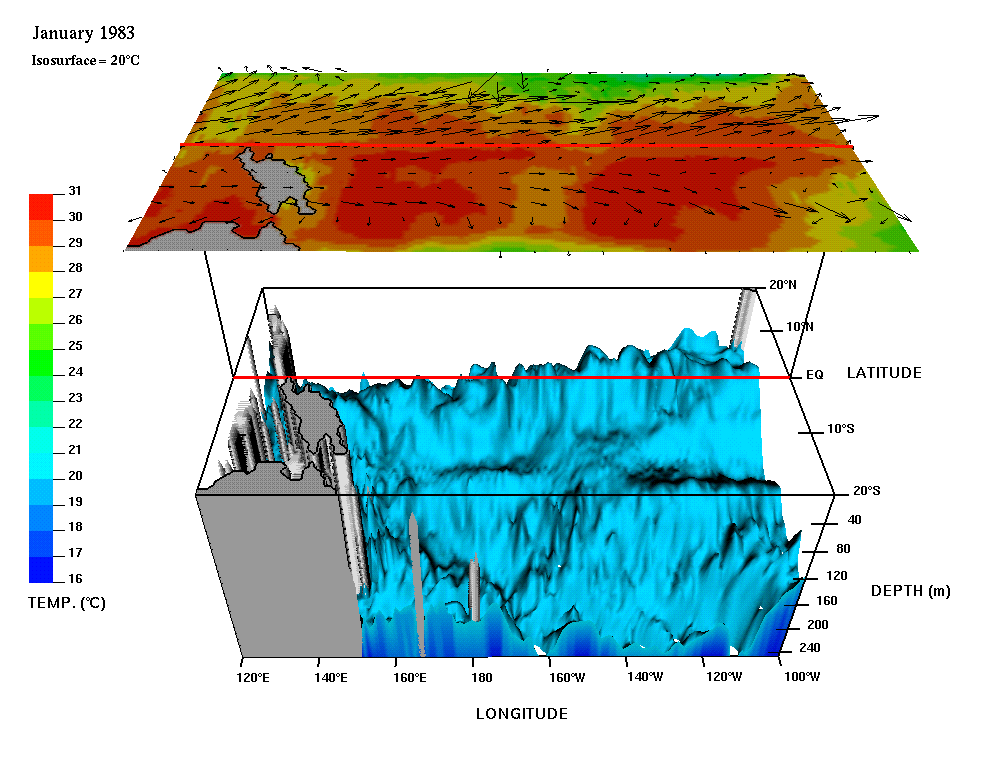
Ocean temperature anomalies at the peak of an El Niño event, simulated in a state-of-the-art climate model at GFDL/NOAA. The temperature changes (see figure below) affect ocean ecosystems and global weather patterns, with far-reaching consequences for fisheries, agriculture, and natural disasters. Worldwide losses resulting from the 1997-98 El Niño are estimated at $32-$96 billion.
Ocean Temperature
Temperature changes (red indicates 1°C or more above normal, blue 1°C or more below normal).
Details
Title |
Ocean Temperature |
Description |
Temperature changes (red indicates 1°C or more above normal, blue 1°C or more below normal). |
Model name |
|
Scientist(s) |
Anthony Rosati, Andrew Wittenberg |
Date Created |
|
Visualization personnel |
|
Files |
MOV (5.5 MB) PNG (549KB) |
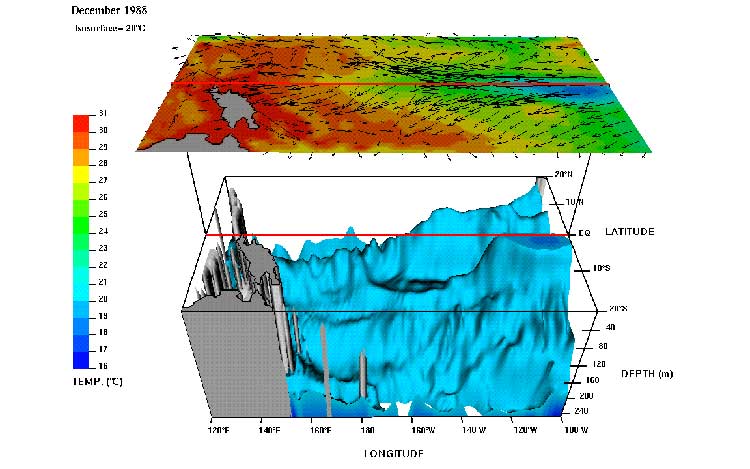
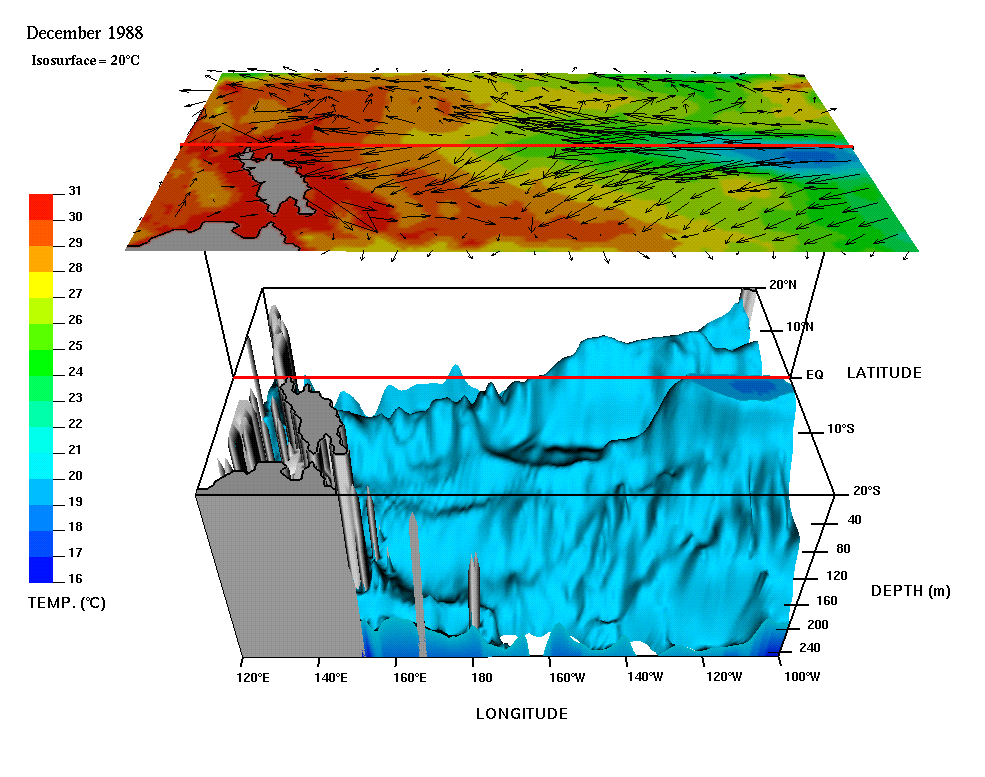
Warm Phase
Modeled ocean temperature and surface current distribution over the tropical Pacific Ocean region obtained from a GFDL coupled ocean-atmosphere model used to predict El Nino/Southern Oscillation (ENSO).
Details
Title |
Warm Phase |
Description |
Modeled ocean temperature and surface current distribution over the tropical Pacific Ocean region obtained from a GFDL coupled ocean-atmosphere model used to predict El Nino/Southern Oscillation (ENSO). |
Model name |
|
Scientist(s) |
Anthony Rosati, Andrew Wittenberg |
Date Created |
|
Visualization personnel |
|
Files |
MOV (5.5MB) GIF (105 KB) |
Cold Phase
Modeled ocean temperature and surface current distribution over the tropical Pacific Ocean region obtained from a GFDL coupled ocean-atmosphere model used to predict El Nino/Southern Oscillation (ENSO).
Details
Title |
Cold Phase |
Description |
Modeled ocean temperature and surface current distribution over the tropical Pacific Ocean region obtained from a GFDL coupled ocean-atmosphere model used to predict El Nino/Southern Oscillation (ENSO). |
Model name |
|
Scientist(s) |
Anthony Rosati, Andrew Wittenberg |
Date Created |
|
Visualization personnel |
|
Files |
MOV (5.5MB) GIF (108KB) |