

Data Visualizations – Hurricanes
These animations are offered as examples of scientific research results, to convey complex information in graphic form.
Redistribution of these materials is permitted, but we ask that NOAA/GFDL be credited as the source, and that we be informed of the usage. Please also see our Disclaimers and Privacy Policy. You can also create visualizations with some of GFDL’s climate data using NOAA’s data exploration tool, NOAAView.
For questions, please contact oar.gfdl.communications@noaa.gov
Model Generated Hurricanes
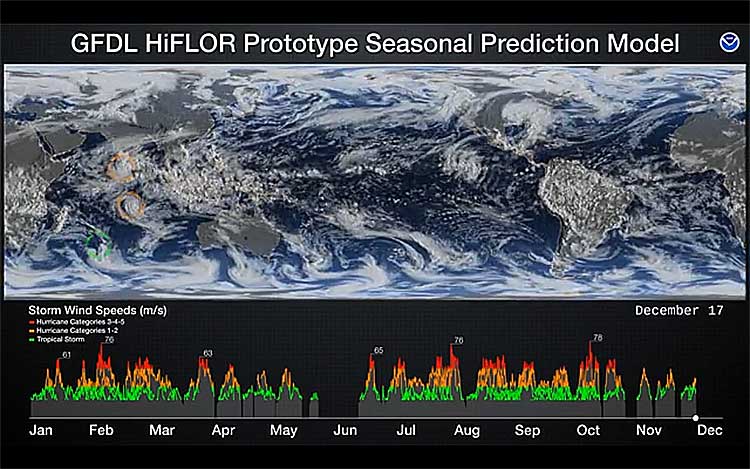
GFDL High Resolution Forecast Low Ocean Resolution (HiFLOR) Prototype Seasonal Prediction Model
Title |
GFDL High Resolution Forecast Low Ocean Resolution (HiFLOR) Prototype Seasonal Prediction Model |
Description |
|
Model name |
|
Scientist(s) |
|
Date Created |
|
Visualization personnel |
|
Files |
MP4 (107 MB) |
Sandy-like storms in NOAA-GFDL Research Model
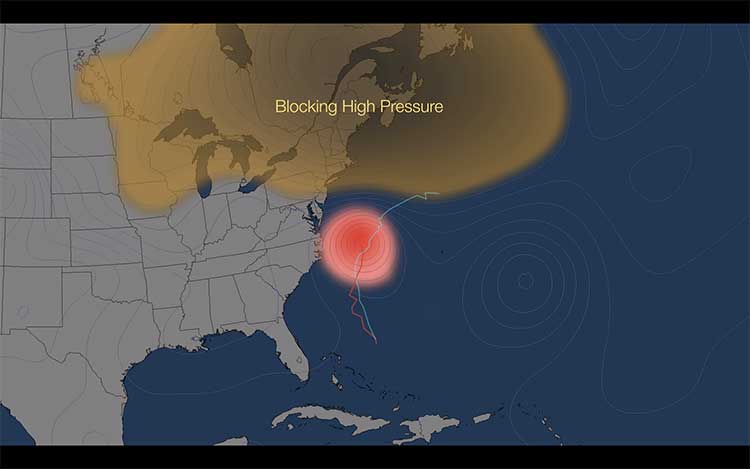
NOAA-GFDL’s high-resolution global ocean-atmosphere-land-ice model (FLOR) for the understanding and prediction of global and regional climate on timescales of months to decades spontaneously generates Sandy-like storms…
Details
Title |
Sandy-like storms in NOAA-GFDL Research Model |
Description |
NOAA-GFDL’s high-resolution global ocean-atmosphere-land-ice model (FLOR) for the understanding and prediction of global and regional climate on timescales of months to decades spontaneously generates Sandy-like storms, with the distinctive and unusual “left hook” into the U.S. east coast. This model can be used to explore the conditions that lead to “Sandy-like” storms in the Atlantic, and other unusual extreme events, to help improve our understanding and ability to predict unusual extreme events. |
Model name |
GFDL-FLOR |
Scientist(s) |
Gabriel Vecchi |
Date Created |
March 2013 |
Visualization personnel |
Dan Pisut |
Files |
MP4 (37 MB) |
Hurricane vortices in a global atmospheric model
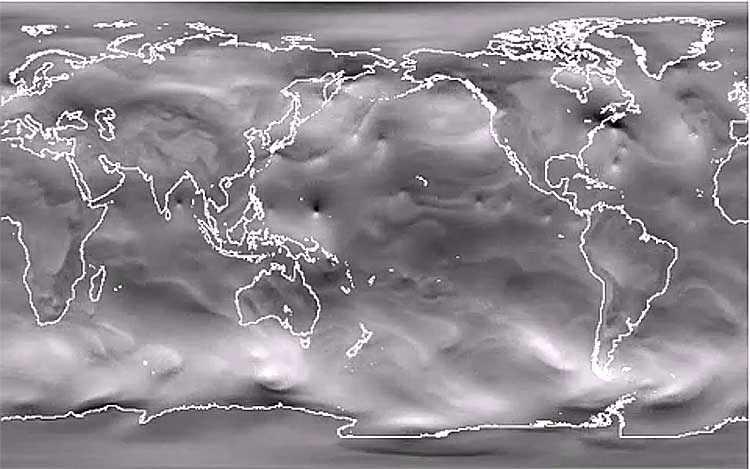
A snapshot of the surface wind field in a version of GFDL’s HiRAM model with 50 km horizontal resolution, a model that develops tropical cyclones with a realistic spatial distribution and frequency. One such tropical cyclone can be seen off the coast of Florida in this snapshot.
Details
Title |
Hurricane vortices in a global atmospheric model |
Description |
A snapshot of the surface wind field in a version of GFDL’s HiRAM model with 50 km horizontal resolution, a model that develops tropical cyclones with a realistic spatial distribution and frequency. One such tropical cyclone can be seen off the coast of Florida in this snapshot. This is an atmospheric model used in conjunction with the sea surface temperatures (SST) projected for the coming century by models of much lower resolution to provide an estimate of how tropical cyclones may change in the future. The histogram indicates how the frequency of Atlantic hurricanes will change in the future, according to this model, given the SSTs projected by a variety of CMIP3 and CMIP5 models. Differences in the spatial patterns of SST projections have large effects on these North Atlantic hurricane frequency changes, with some SST projections resulting in increases and some decreases in frequency. This sobering result suggests that more definitive projections of the spatial pattern of ocean temperature changes are a prerequisite for better projections of changes in tropical cyclone statistics. Results from Hi/RAM and 4 other GFDL models were provided to the community and the AR5 authors through the CMIP5 archive. |
Model name |
GFDL C180HiRAM |
Scientist(s) |
Isaac Held, Ming Zhao, S.J. Lin |
Date Created |
February 22, 2011 |
Visualization personnel |
Isaac Held, using ncview |
Files |
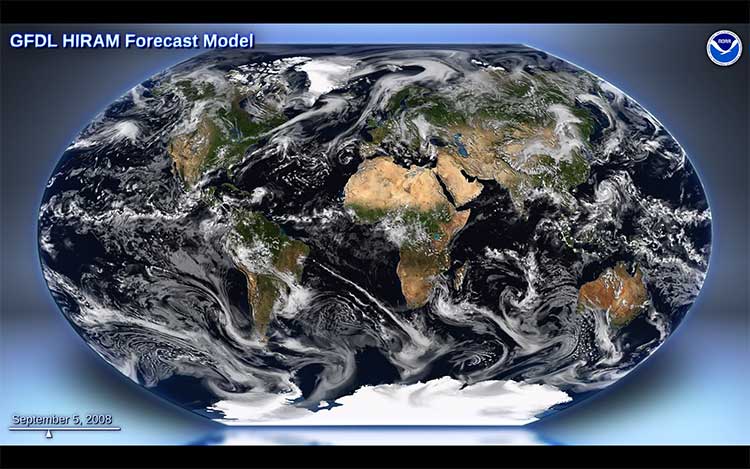
Data-driven simulation of the peak 2008 hurricane season
The peak of the 2008 hurricane season is simulated using GFDL’s High Resolution Atmosphere Model (HiRAM), at 12.5km resolution. To keep the simulation as close to the true state of the atmosphere as possible, the large-scale…
Details
Title |
Data-driven simulation of the peak 2008 hurricane season |
Description |
The peak of the 2008 hurricane season is simulated using GFDL’s High Resolution Atmosphere Model (HiRAM), at 12.5km resolution. To keep the simulation as close to the true state of the atmosphere as possible, the large-scale component of the model’s 3D flow is nudged towards the NCEP analysis, while the vortex-scale motion is nudged towards the observed hurricane tracks and intensity. This animation shows the cloud pattern (vertically integrated sum of cloud ice, cloud liquid water, snow, rain, and small hail) associated with hurricanes from August 25 to October 1 (one hour per frame). |
Model name |
GFDL High Resolution Atmosphere Model (HiRAM) with a 6-category bulk cloud micro-physics |
Scientist(s) |
S.J. Lin |
Date Created |
September 2011 |
Visualization personnel |
Remik Ziemlinski |
Files |
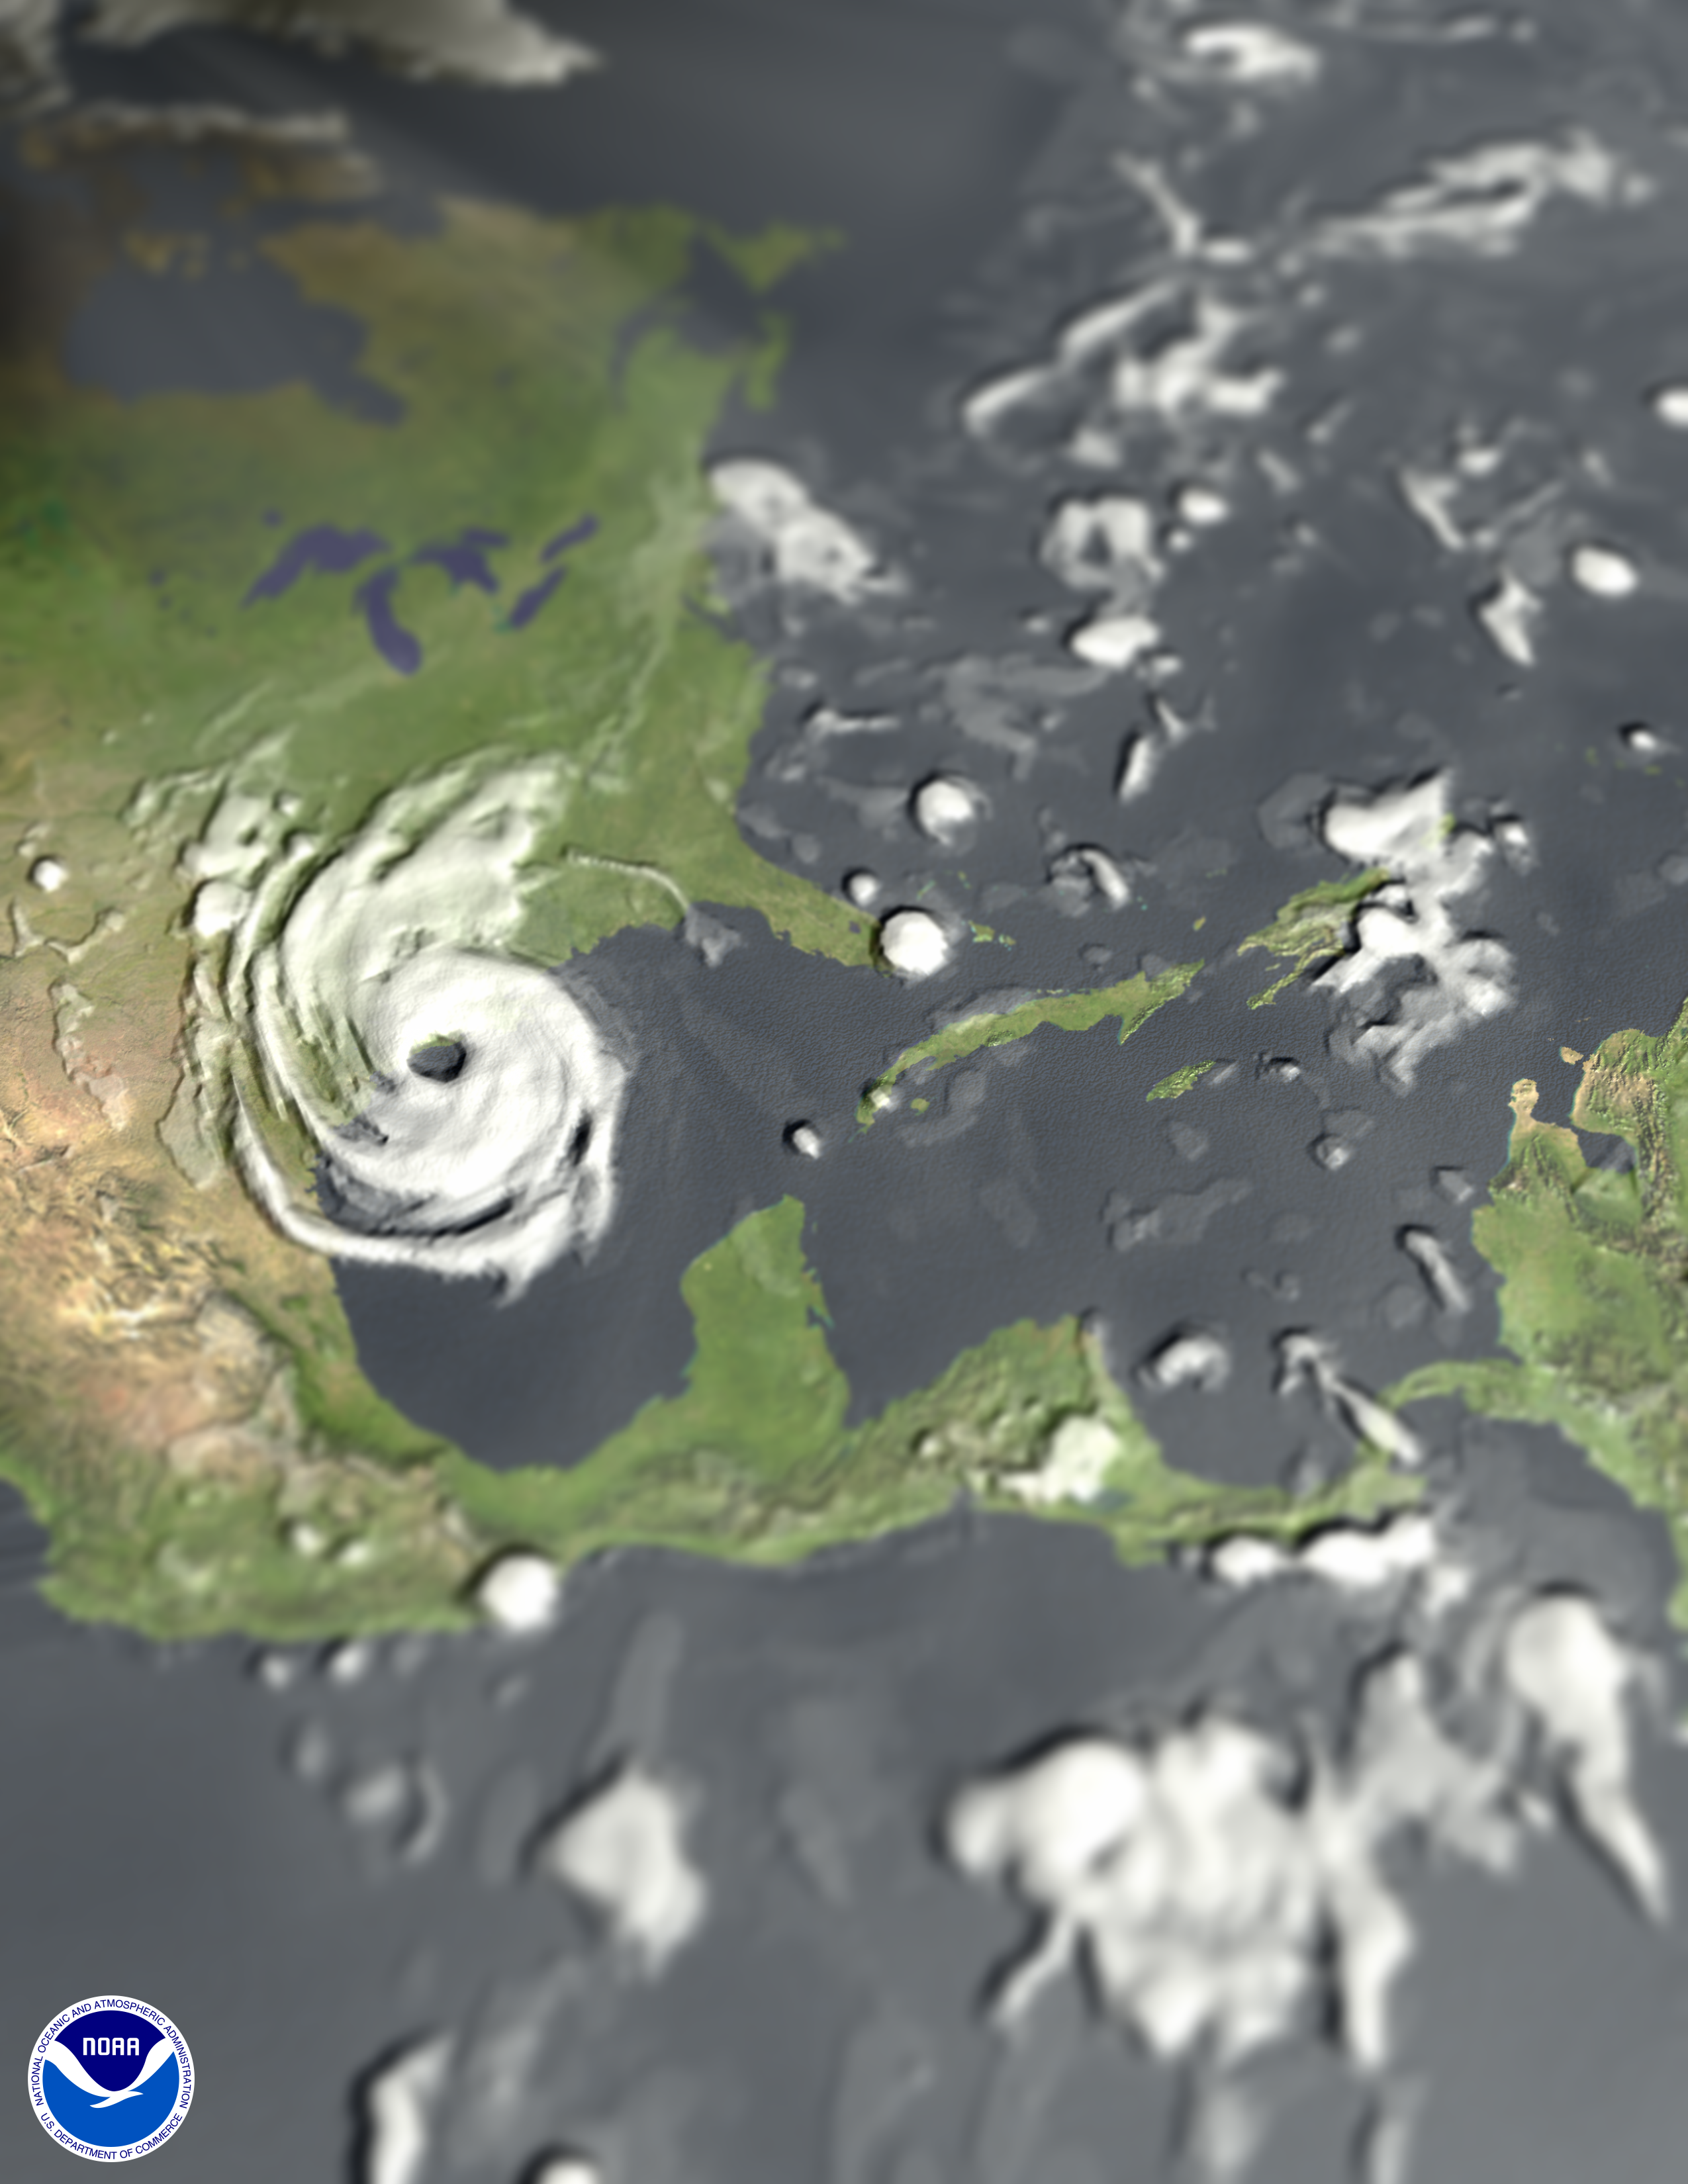
Simulated clouds and weather systems generated for a three-month period (Aug-Oct 2005) using the GFDL Zetac regional atmospheric model. These visualizations are also available as supplemental material for the Nature Geosciences letter Simulated reduction in Atlantic hurricane frequency under twenty-first-century warming conditions.
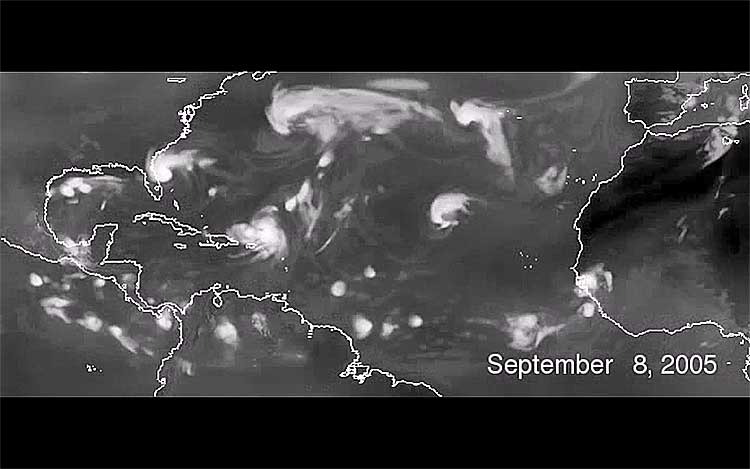
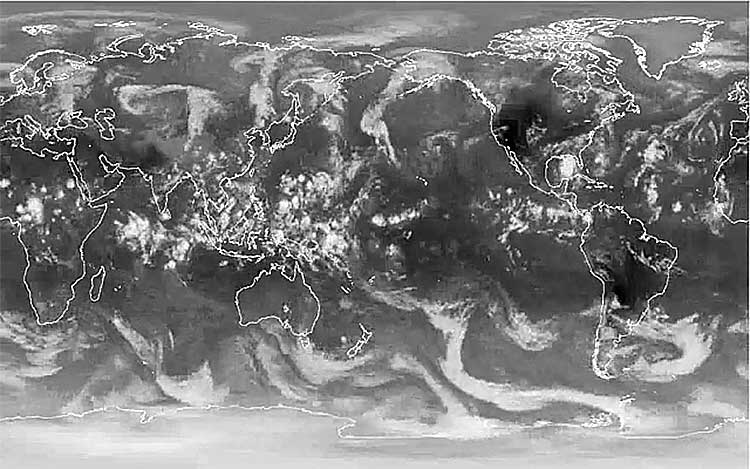
Model Outgoing Longwave Radiation (OLR)
An animation of simulated clouds and weather systems generated for a three-month period (Aug-Oct 2005) using the GFDL Zetac regional atmospheric model. The brightest shading in the tropical parts of the domain corresponds to…
Details
Title |
Model Outgoing Longwave Radiation (OLR) |
Description |
An animation of simulated clouds and weather systems generated for a three-month period (Aug-Oct 2005) using the GFDL Zetac regional atmospheric model. The brightest shading in the tropical parts of the domain corresponds to high clouds associated with storms and deep tropical convection. Land reflectivity image courtesy NASA Reproduced as cover art in the June 2008 printing of Nature Geoscience. |
Model name |
GFDL ZETAC |
Scientist(s) |
Tom Knutson Isaac Held Steve Garner Joe Sirutis Gabe Vecchi |
Date Created |
2008-05-15 |
Visualization personnel |
Remik Ziemlinski |
Files |
AVI (10MB) MOV (26MB) WMV (15MB) PNG (4.8 MB) |
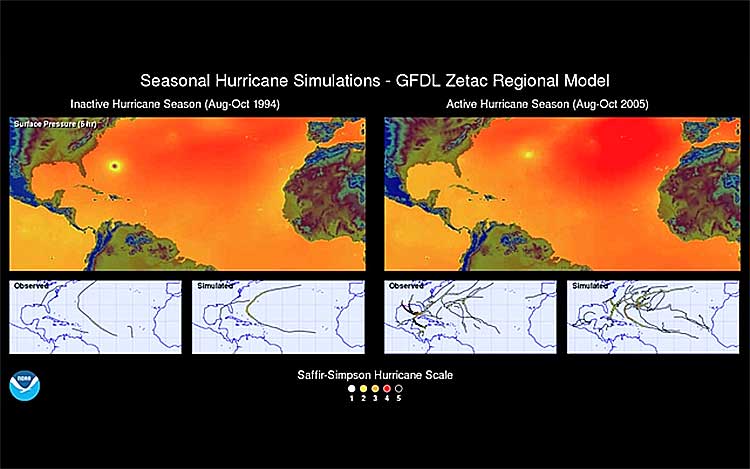
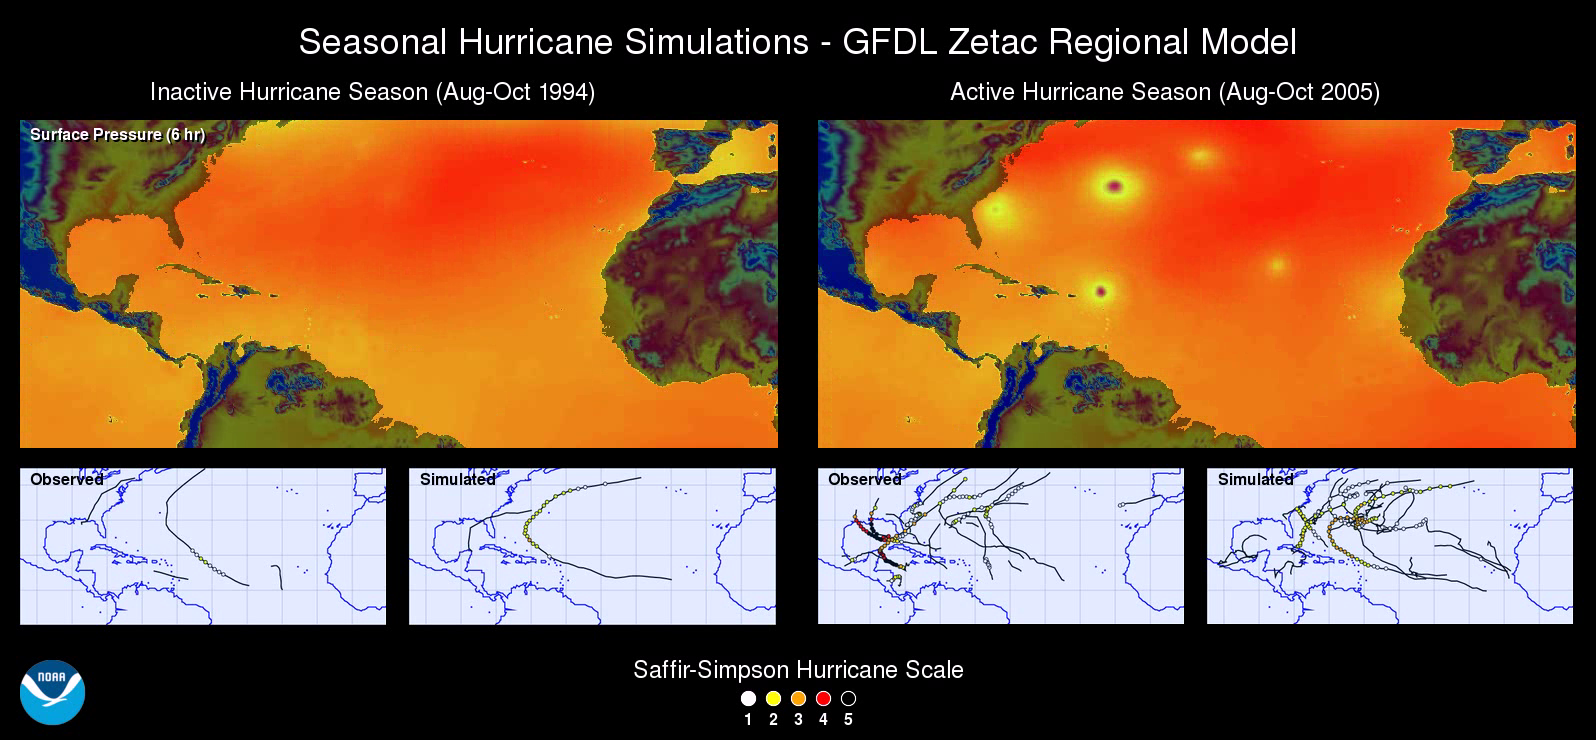
Model Surface Pressure
Two contrasting seasons are compared–an inactive (1994) and an active (2005) hurricane season. In this animation, model-generated tropical storms, hurricanes, and strong extratropical storms are apparent as intense low- pressure systems that travel through the domain…
Details
Title |
Model Surface Pressure |
Description |
Two contrasting seasons are compared–an inactive (1994) and an active (2005) hurricane season. In this animation, model-generated tropical storms, hurricanes, and strong extratropical storms are apparent as intense low- pressure systems that travel through the domain. Bottom panels show the observed and simulated storm tracks for the two seasons. Note how the model produces highly contrasting overall activity levels for the two seasons, similar to that observed. |
Model name |
GFDL ZETAC |
Scientist(s) |
Tom Knutson Isaac Held Steve Garner Joe Sirutis Gabe Vecchi |
Date Created |
2008-05-15 |
Visualization personnel |
Dan Pisut |
Files |
AVI (6MB) MOV (21MB) WMV (6MB) PNG (3.5MB) |
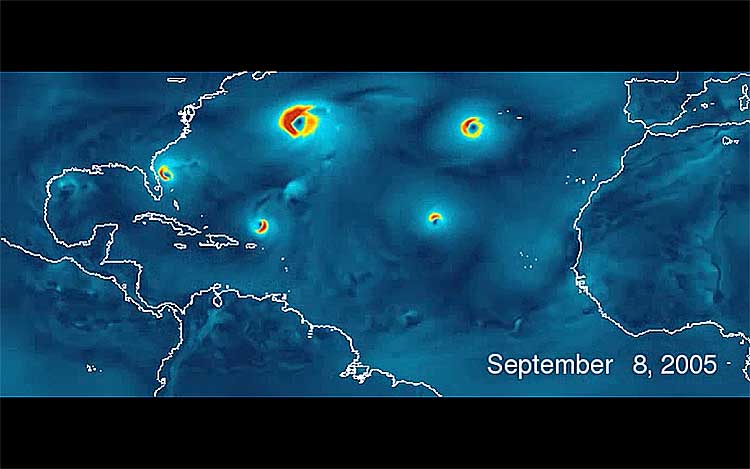
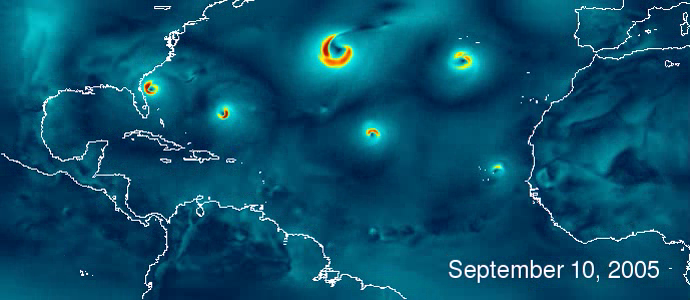
Boundary Layer Wind Speed
Animation of low-level wind speeds from a three month simulation using the GFDL Zetac regional atmospheric model. Model-generated tropical storms, hurricanes, and strong extratropical storms…
Details
Title |
Boundary Layer Wind Speed |
Description |
Animation of low-level wind speeds from a three month simulation using the GFDL Zetac regional atmospheric model. Model-generated tropical storms, hurricanes, and strong extratropical storms are apparent as wind speed maxima that travel through the domain. Red colors roughly denote surface wind speeds above hurricane strength (>33 m s-1). |
Model name |
GFDL ZETAC |
Scientist(s) |
Tom Knutson Isaac Held Steve Garner Joe Sirutis Gabe Vecchi |
Date Created |
2008-05-15 |
Visualization personnel |
|
Files |
AVI (5MB) MOV (14MB) WMV (6MB) PNG (608KB) |
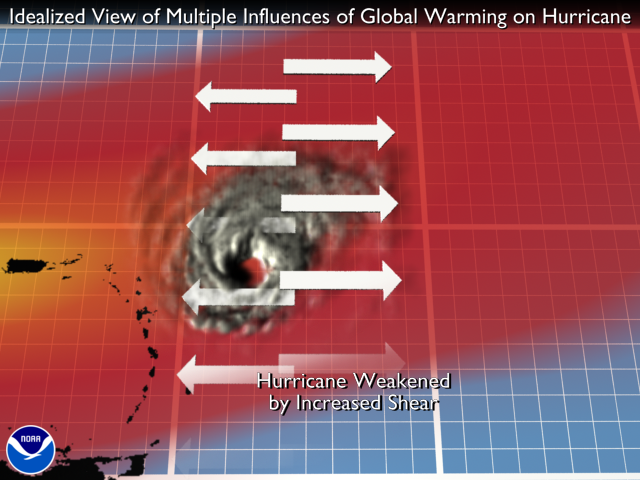
Schematic Representations of Storms
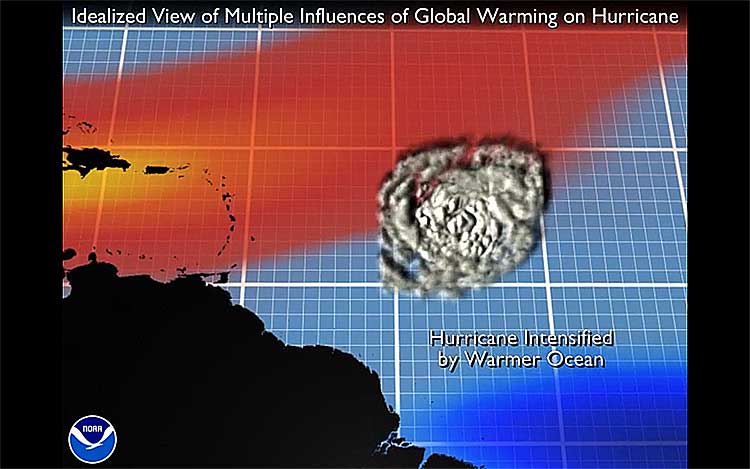
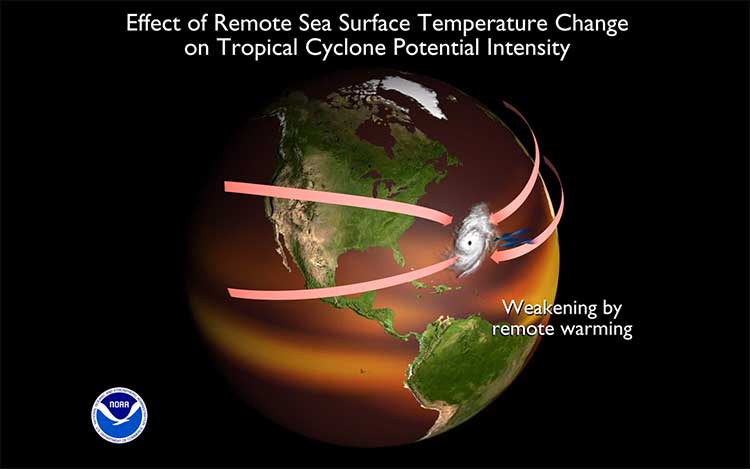
Idealized View of Multiple Influences of Global Warming on Hurricane
This animation illustrates the factors likely to influence Atlantic hurricanes under CO2 induced global warming. On the one hand, the oceans are projected to warm, increasing the thermodynamic potential of hurricanes.
Details
Title |
Idealized View of Multiple Influences of Global Warming on Hurricane |
Description |
This animation illustrates the factors likely to influence Atlantic hurricanes under CO2 induced global warming. On the one hand, the oceans are projected to warm, increasing the thermodynamic potential of hurricanes. On the other hand, vertical wind shear is projected to increase, the effect of which should be in the opposite sense to that of the warming oceans. What is the effect of both factors together?Even though the effect of each factor in isolation is well established, the net effect of warming oceans and increased shear on Atlantic hurricane intensity and frequency is yet to be understood. It is also important to note that the model-projected increase in vertical wind shear is limited to the East Pacific and Tropical Atlantic, with other regions showing a decrease in wind shear (see Vecchi and Soden (2007) for discussion). |
Model name |
Idealized Visualization |
Scientist(s) |
Gabriel Vecchi, Brian Soden |
Date Created |
2007-04-18 |
Visualization personnel |
Remik Ziemlinski |
Files |
MPG (12MB) MOV (14.4MB) H.264 (7.1MB) PNG (370KB) |
Katrina (2005)
Outgoing Longwave Radiation (OLR)
5-day forecast of hurricane Katrina starting at 00Z August 26, 2005 using a global atmospheric model based on a cubed-sphere grid with 25km resolution.
Details
Title |
Outgoing Longwave Radiation (OLR) |
Description |
5-day forecast of hurricane Katrina starting at 00Z August 26, 2005 using a global atmospheric model based on a cubed-sphere grid with 25km resolution. |
Model name |
GFDL global atmospheric cubed-sphere (C360) |
Scientist(s) |
Shian-Jiann Lin |
Date Created |
2009-01-15 |
Visualization personnel |
|
Files |
MPEG (6.2MB) PNG (1.1MB) |
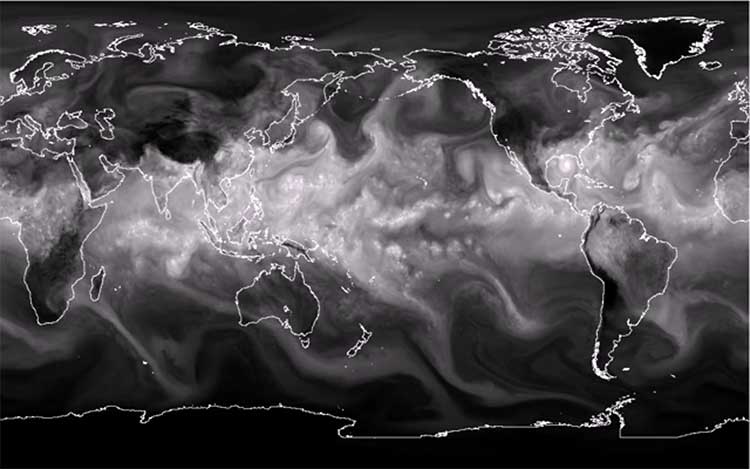
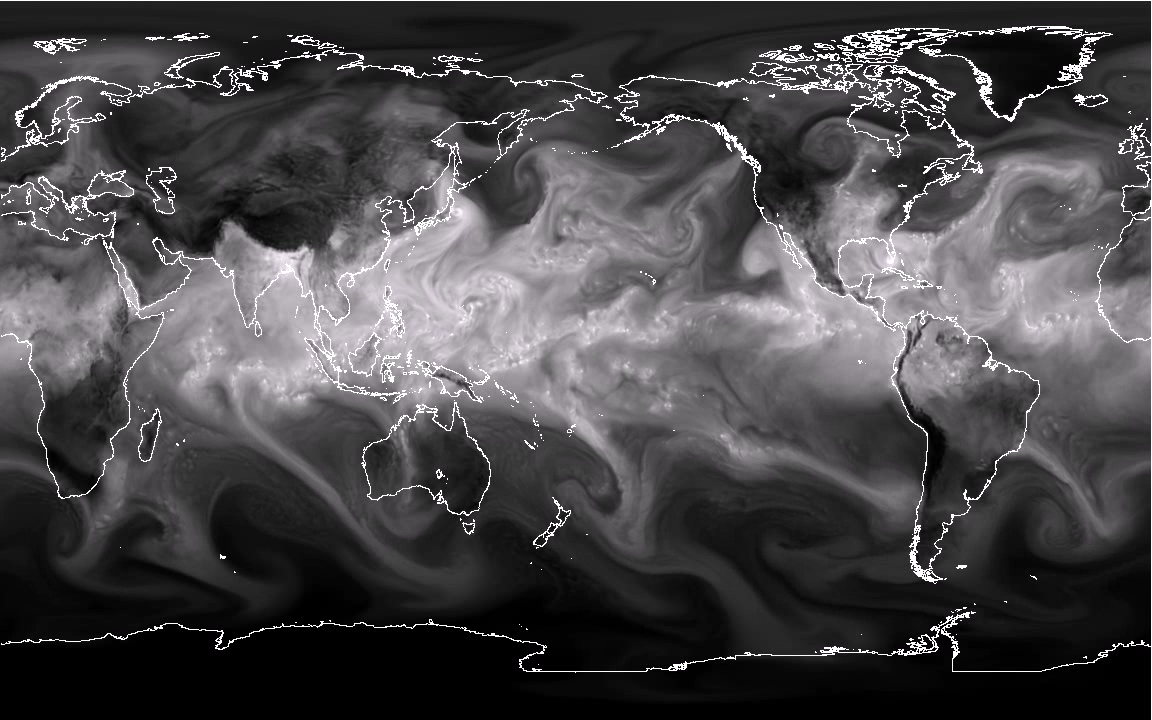
Vertically Integrated Water Vapor
5-day forecast of hurricane Katrina starting at 00Z August 26, 2005 using a global atmospheric model based on a cubed-sphere grid with 25km resolution.
Details
Title |
Vertically Integrated Water Vapor |
Description |
5-day forecast of hurricane Katrina starting at 00Z August 26, 2005 using a global atmospheric model based on a cubed-sphere grid with 25km resolution. |
Model name |
GFDL global atmospheric cubed-sphere (C360) |
Scientist(s) |
Shian-Jiann Lin |
Date Created |
2009-01-15 |
Visualization personnel |
|
Files |
MPEG (2.4MB) PNG (765KB) |
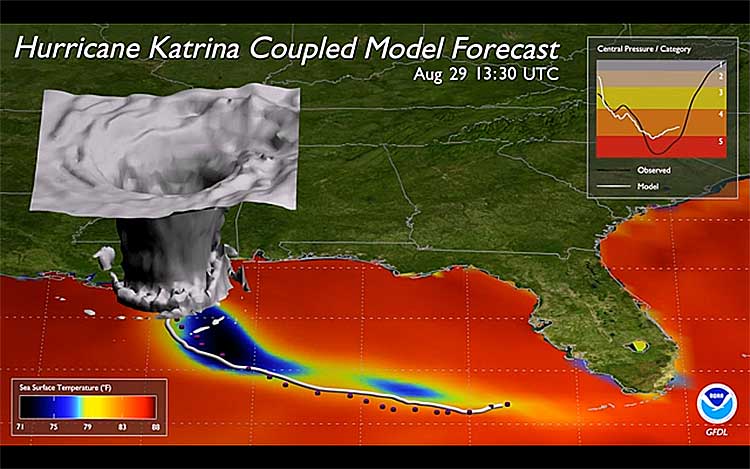
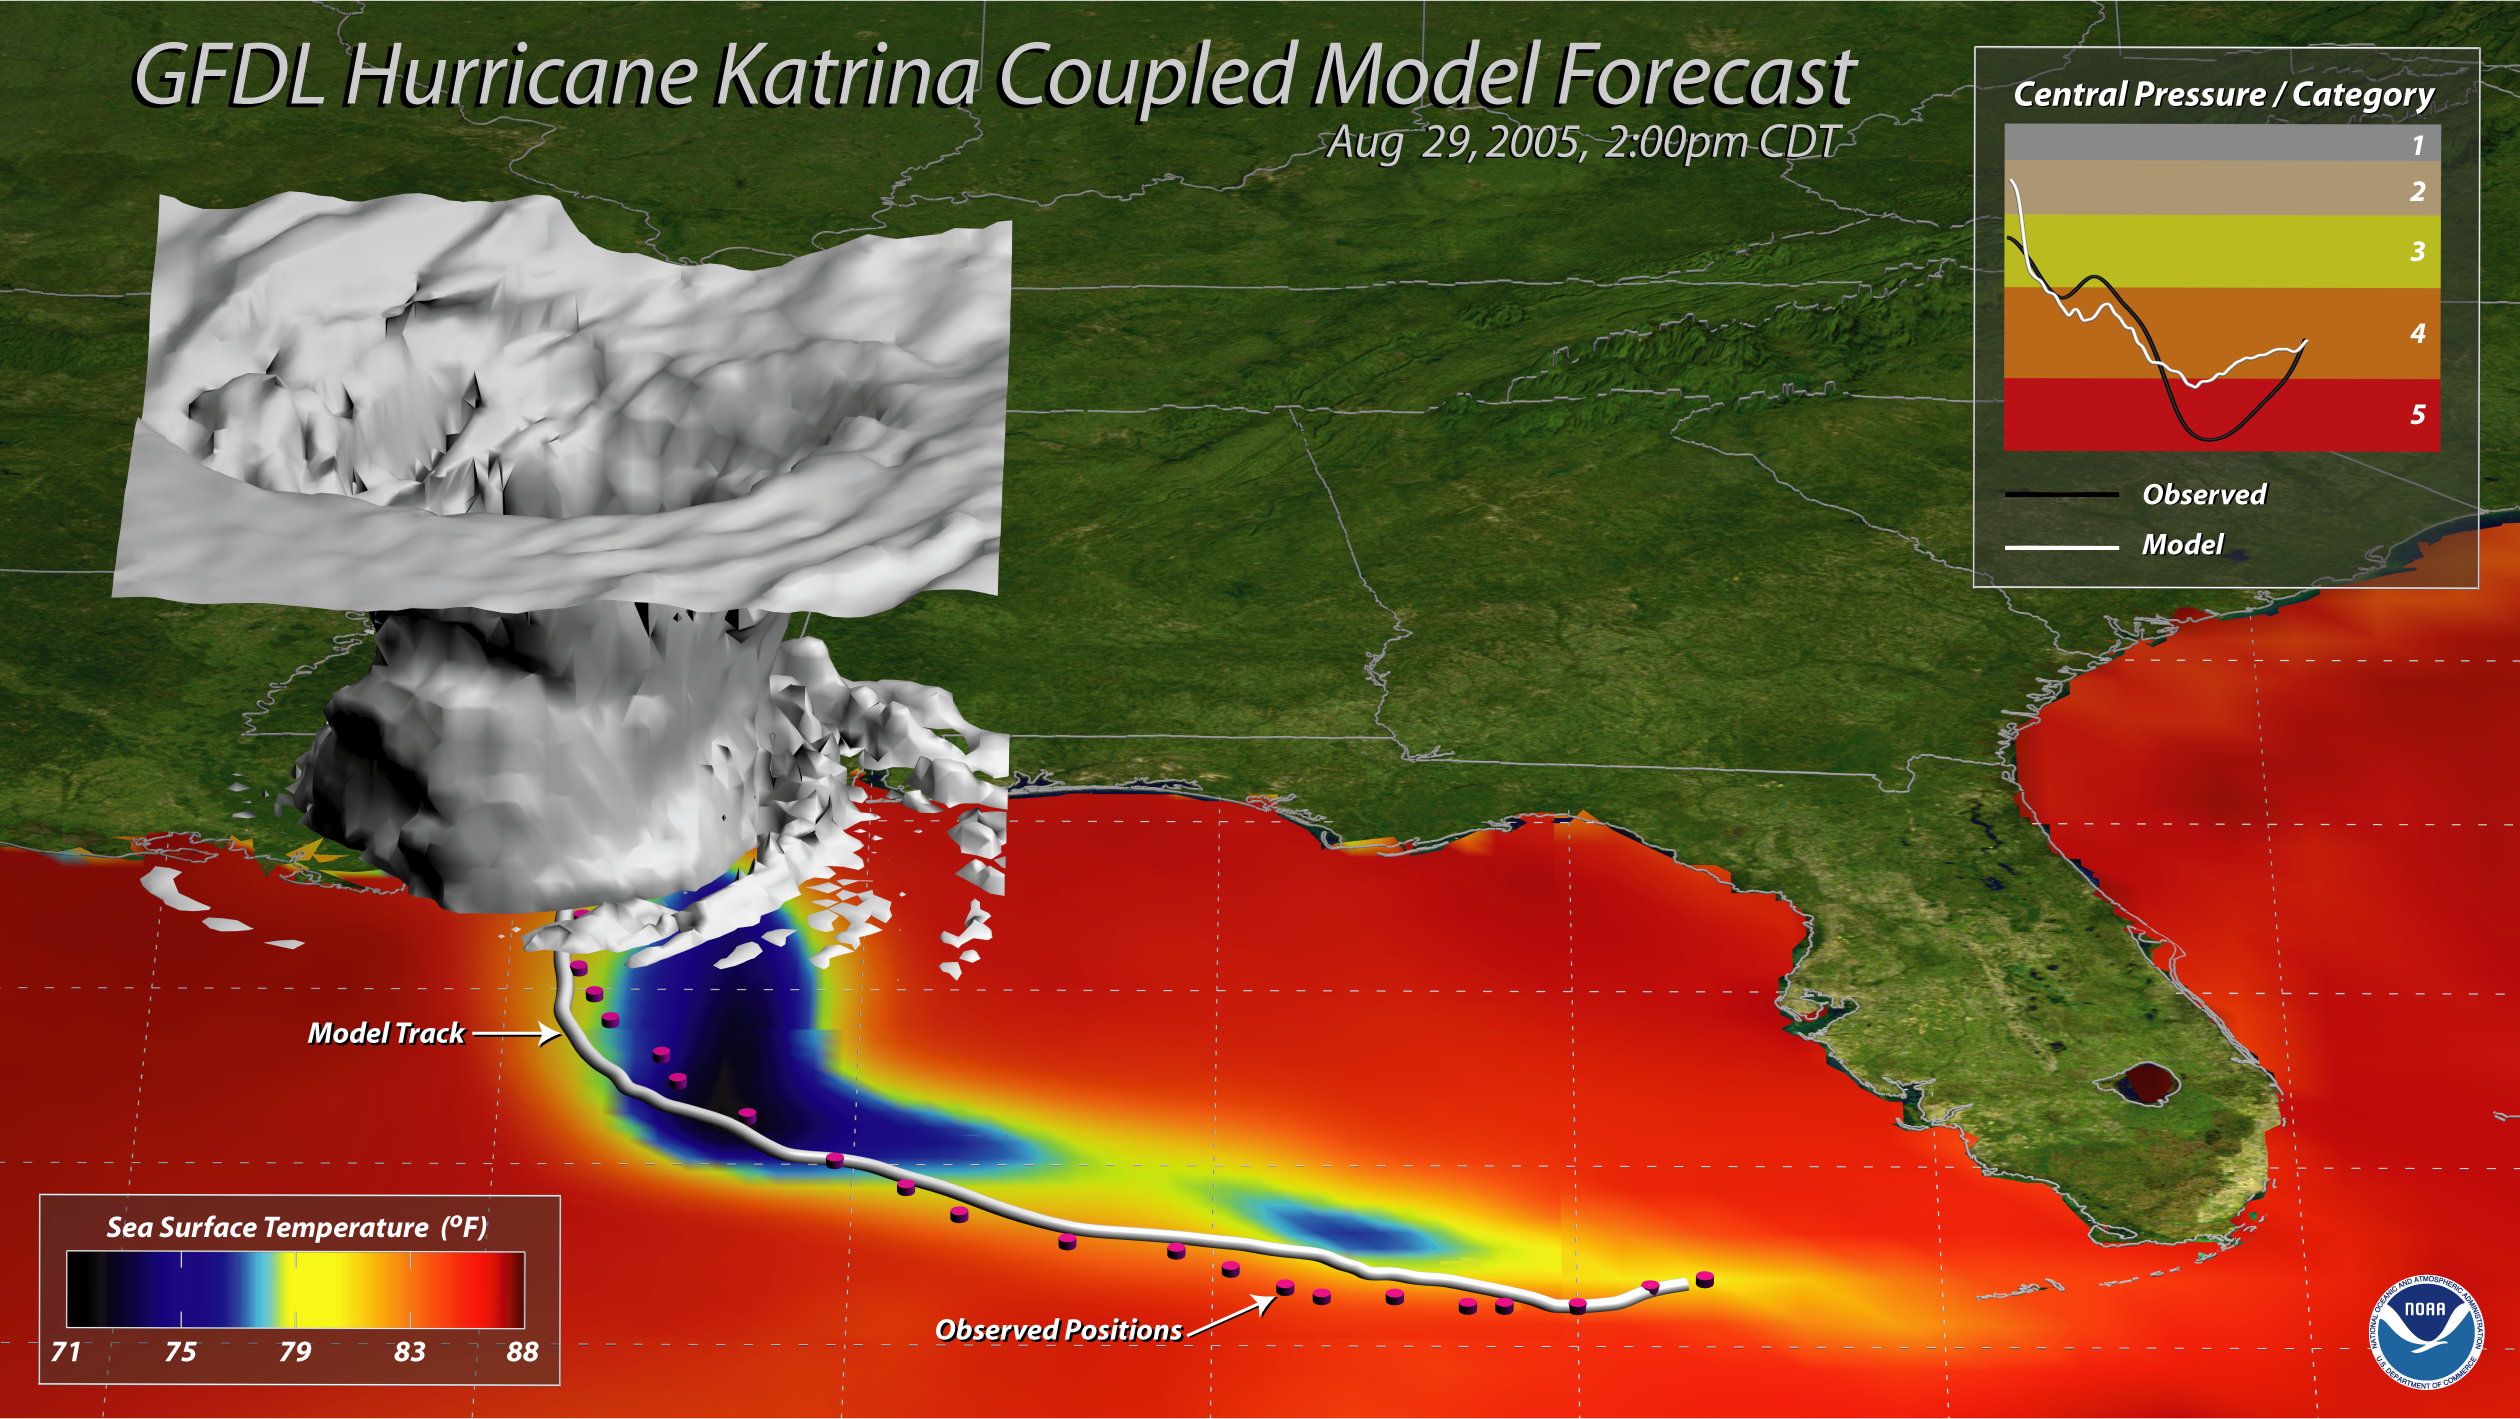
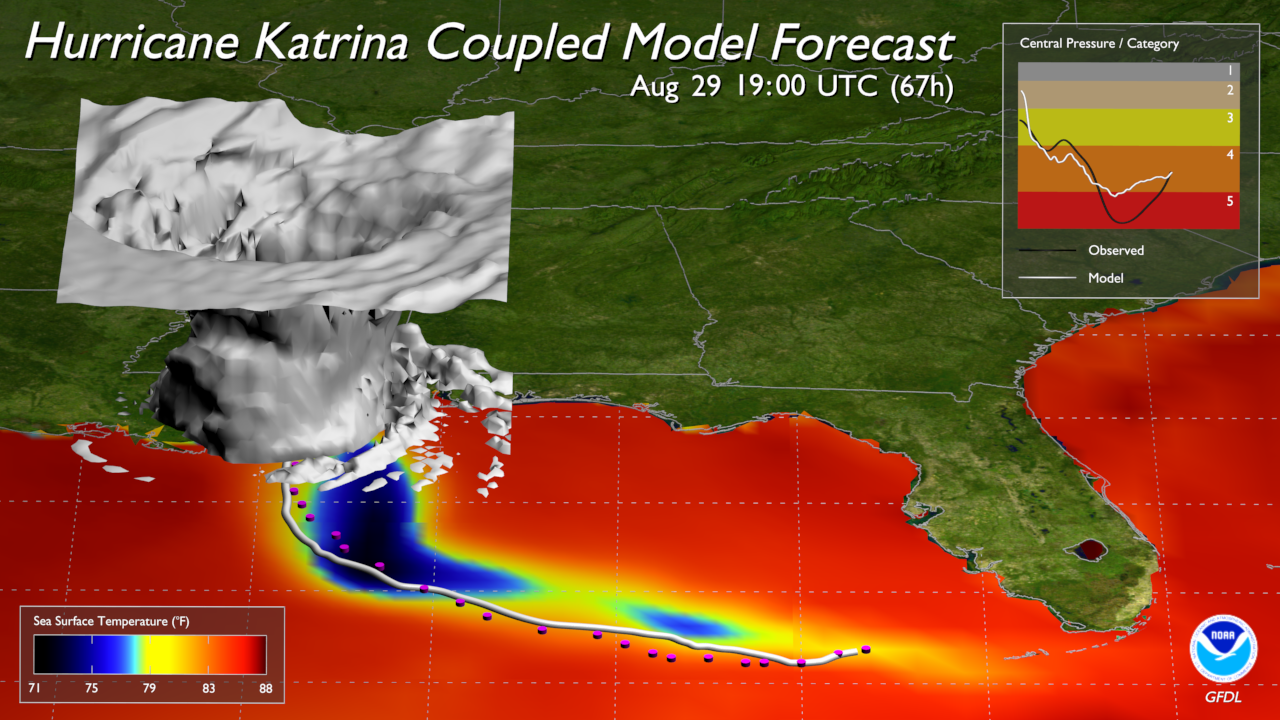
GFDL Operational Hurricane Model Forecast of Katrina
Several hurricane attributes are animated simultaneously for the GFDL Forecast Model of hurricane Katrina revealing a cooling wake in the Gulf of Mexico.
Details
Title |
GFDL Operational Hurricane Model Forecast of Katrina |
Description |
Several hurricane attributes are animated simultaneously for the GFDL Forecast Model of hurricane Katrina revealing a cooling wake in the Gulf of Mexico. |
Model name |
GFDL Operational Hurricane Model |
Scientist(s) |
Morris Bender, Timothy Marchok |
Date Created |
2006 |
Visualization personnel |
Remik Ziemlinski, Hans Vahlenkamp, John Sheldon |
Files |
PNG 2520×1419 (3.4MB) MPEG (5.6MB) PNG (929KB) |
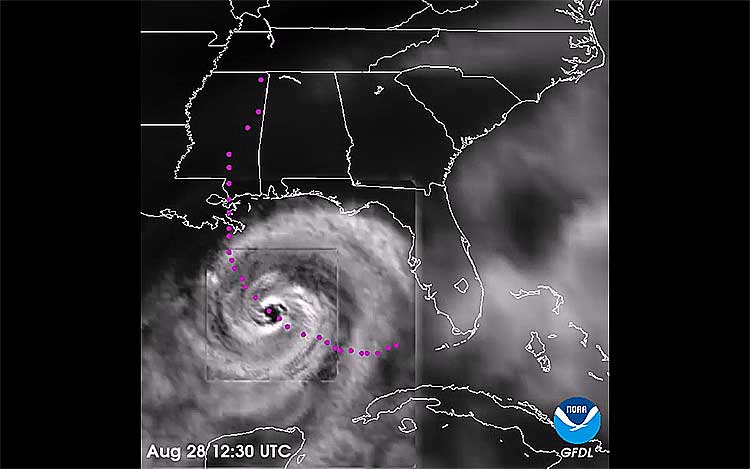
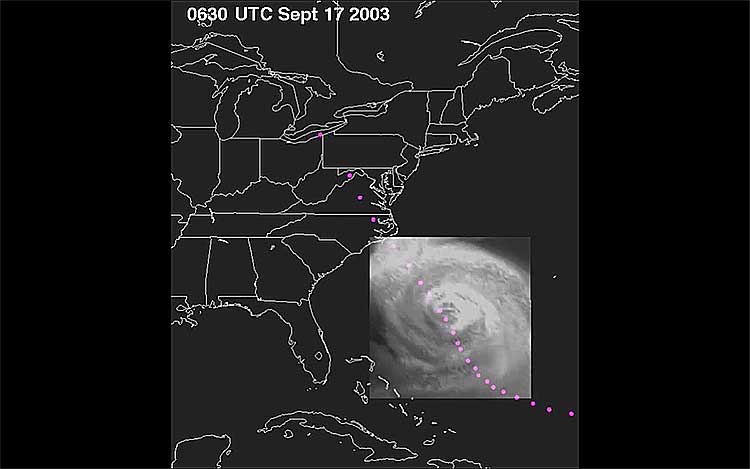
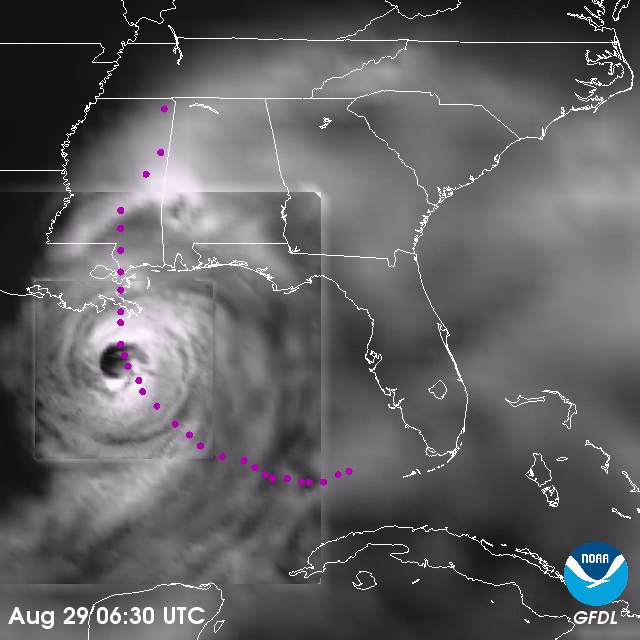
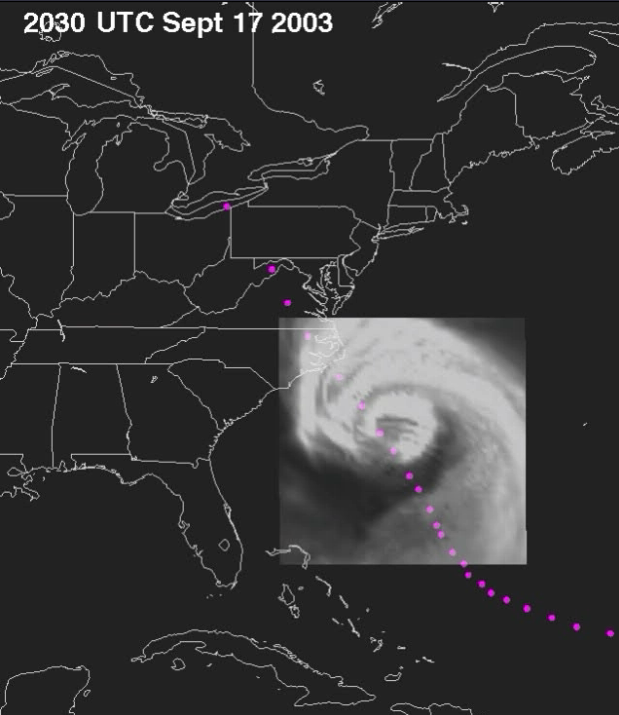
GFDL Operational Hurricane Model Relative Humidity Loop of Katrina
The three-nest structure of the GFDL Hurricane Model can be seen in this animation of vertically integrated relative humidity at half hour intervals between the model dates August 27-30, 2005.
Details
Title |
GFDL Operational Hurricane Model Relative Humidity Loop of Katrina |
Description |
The three-nest structure of the GFDL Hurricane Model can be seen in this animation of vertically integrated relative humidity at half hour intervals between the model dates August 27-30, 2005. The magenta glyphs depict actual observed track positions. Shown here is a model forecast of relative humidity, which can be compared to the actual satellite loop shown below. |
Model name |
GFDL Operational Hurricane Model |
Scientist(s) |
Morris Bender, Timothy Marchok |
Date Created |
2006 |
Visualization personnel |
Remik Ziemlinski, Hans Vahlenkamp, John Sheldon |
Files |
MPEG (4.3MB) PNG (1.2MB) |
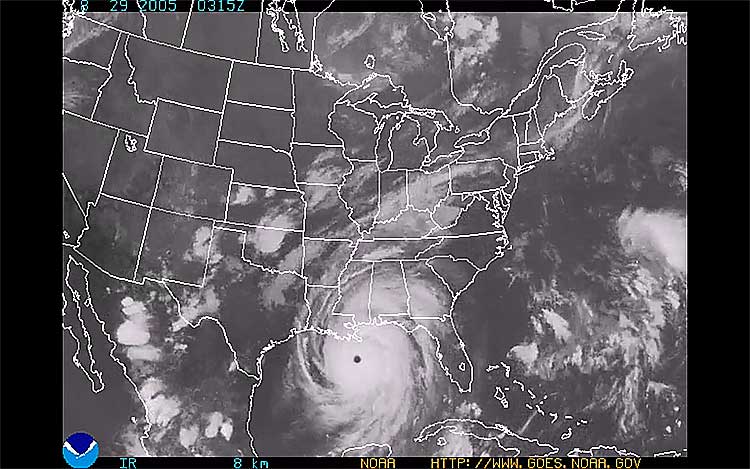
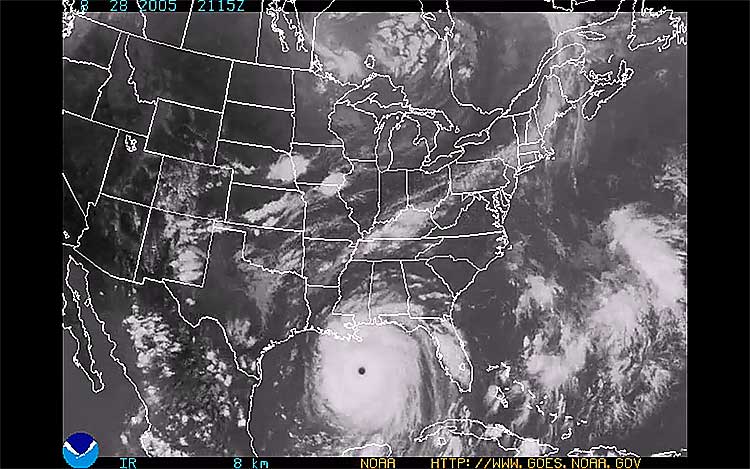
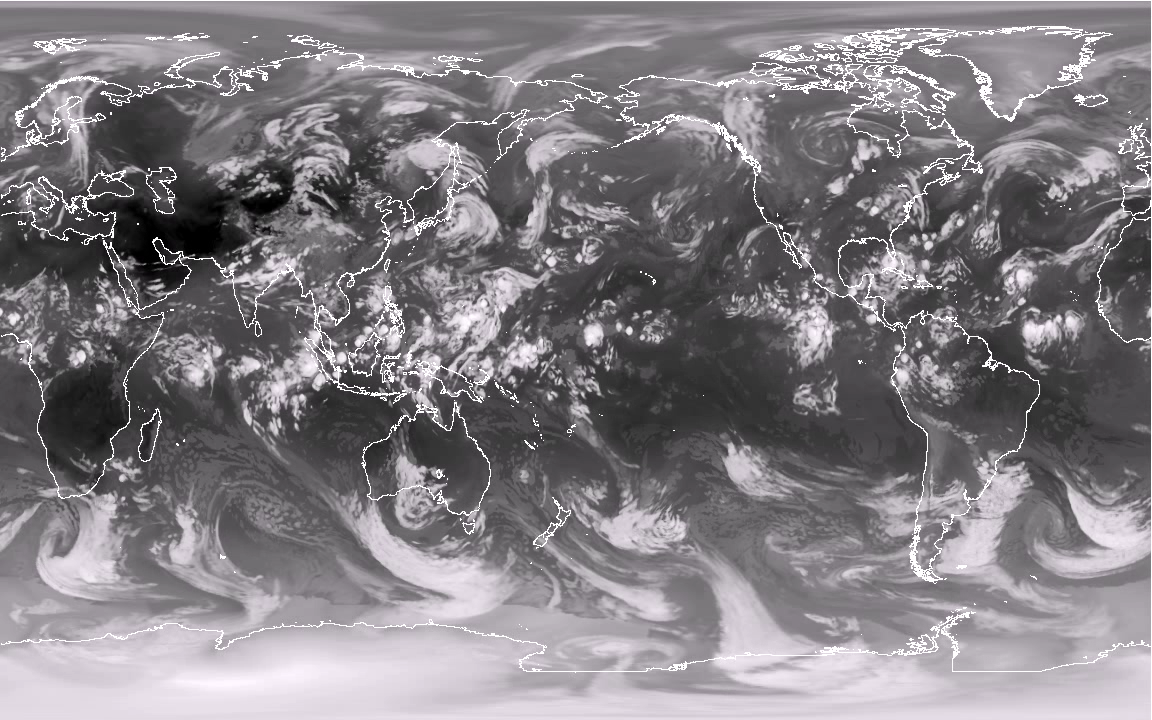
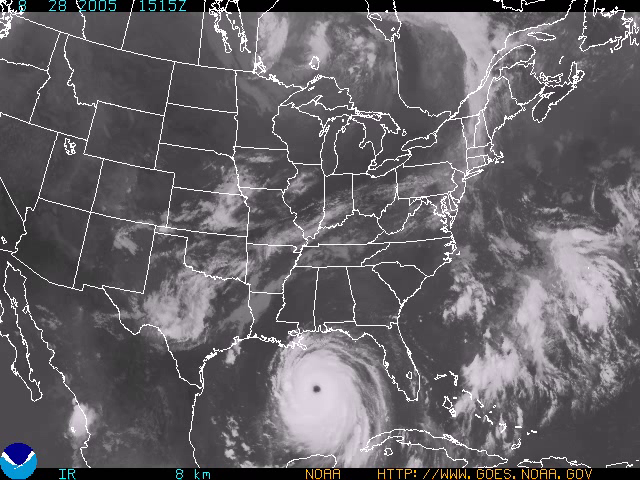
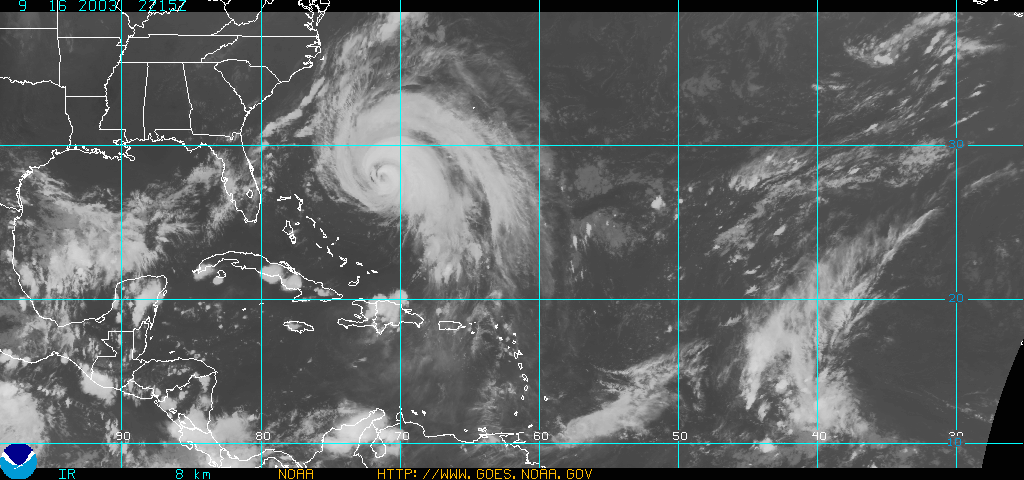
Hurricane Katrina Infrared Satellite Loop
Infrared imagery from the NOAA GOES satellite system have been animated between August 24-30, 2005.
Details
Title |
Hurricane Katrina Infrared Satellite Loop |
Description |
Infrared imagery from the NOAA GOES satellite system have been animated between August 24-30, 2005. |
Model name |
Satellite Loop |
Scientist(s) |
Morris Bender, Timothy Marchok |
Date Created |
2006 |
Visualization personnel |
Remik Ziemlinski, Hans Vahlenkamp, John Sheldon |
Files |
MPEG (20MB) PNG (902KB) |
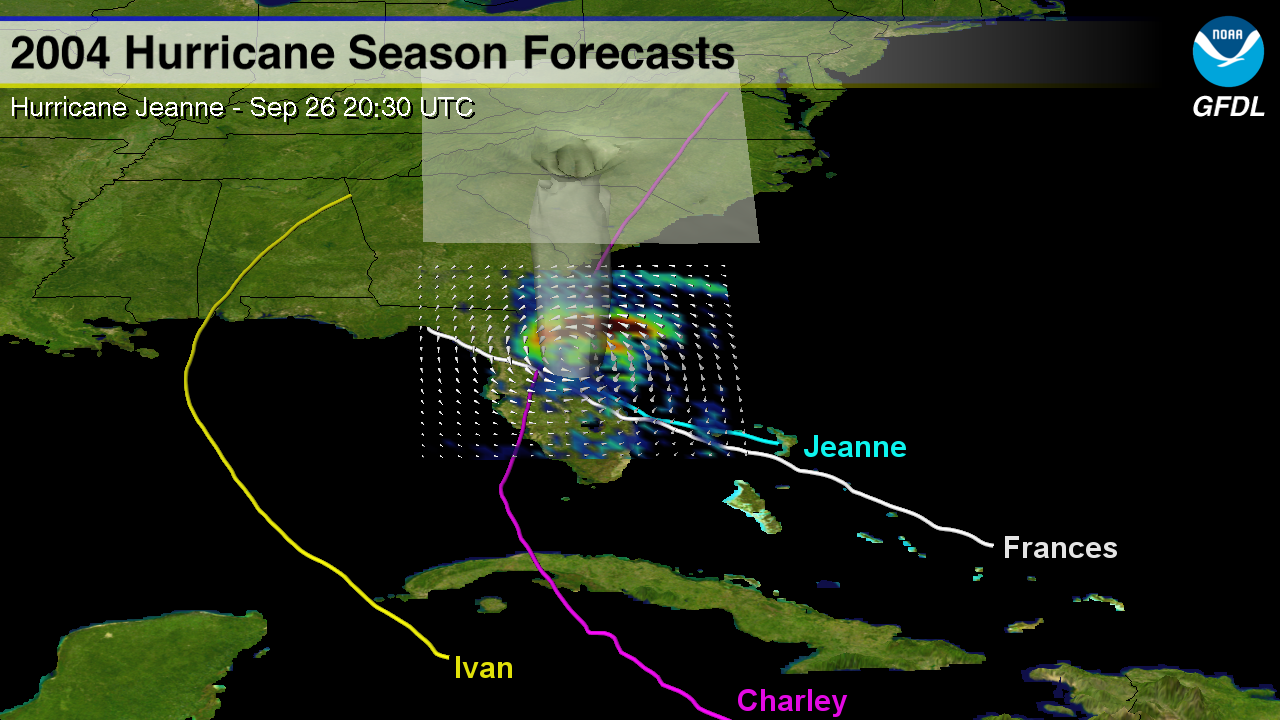
2004 Hurricane Season Model Forecasts
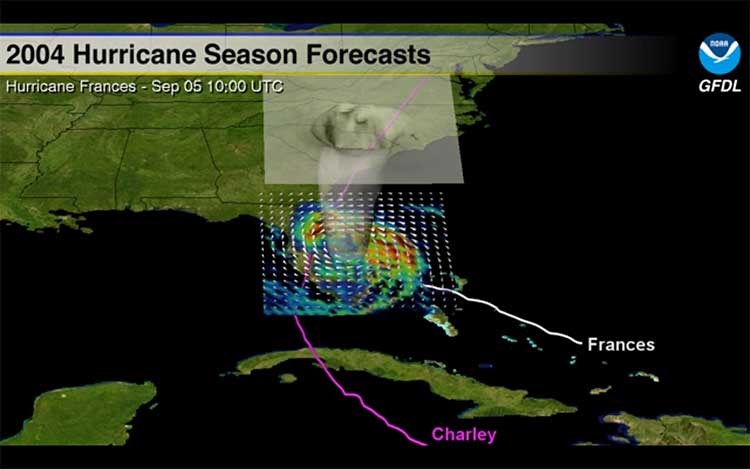
GFDL Operational Hurricane Model Forecast of 2004 Hurricane Season
This sequence shows the model tracks, precipitation and eyewalls for the 2004 hurricanes Charley, Ivan, Frances, and Jeanne.
Details
Title |
GFDL Operational Hurricane Model Forecast of 2004 Hurricane Season |
Description |
This sequence shows the model tracks, precipitation and eyewalls for the 2004 hurricanes Charley, Ivan, Frances, and Jeanne. |
Model name |
GFDL Operational Hurricane Model |
Scientist(s) |
Morris Bender, Timothy Marchok |
Date Created |
2005 |
Visualization personnel |
Remik Ziemlinski |
Files |
MPEG (27.9MB) PNG (636KB) |
Isabel (2003)
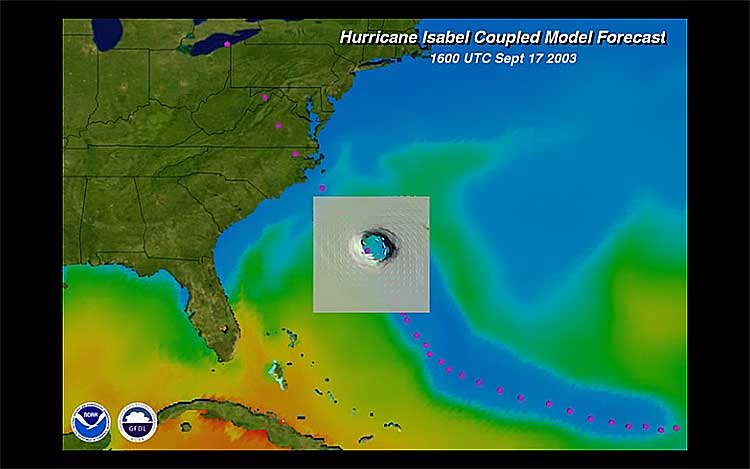
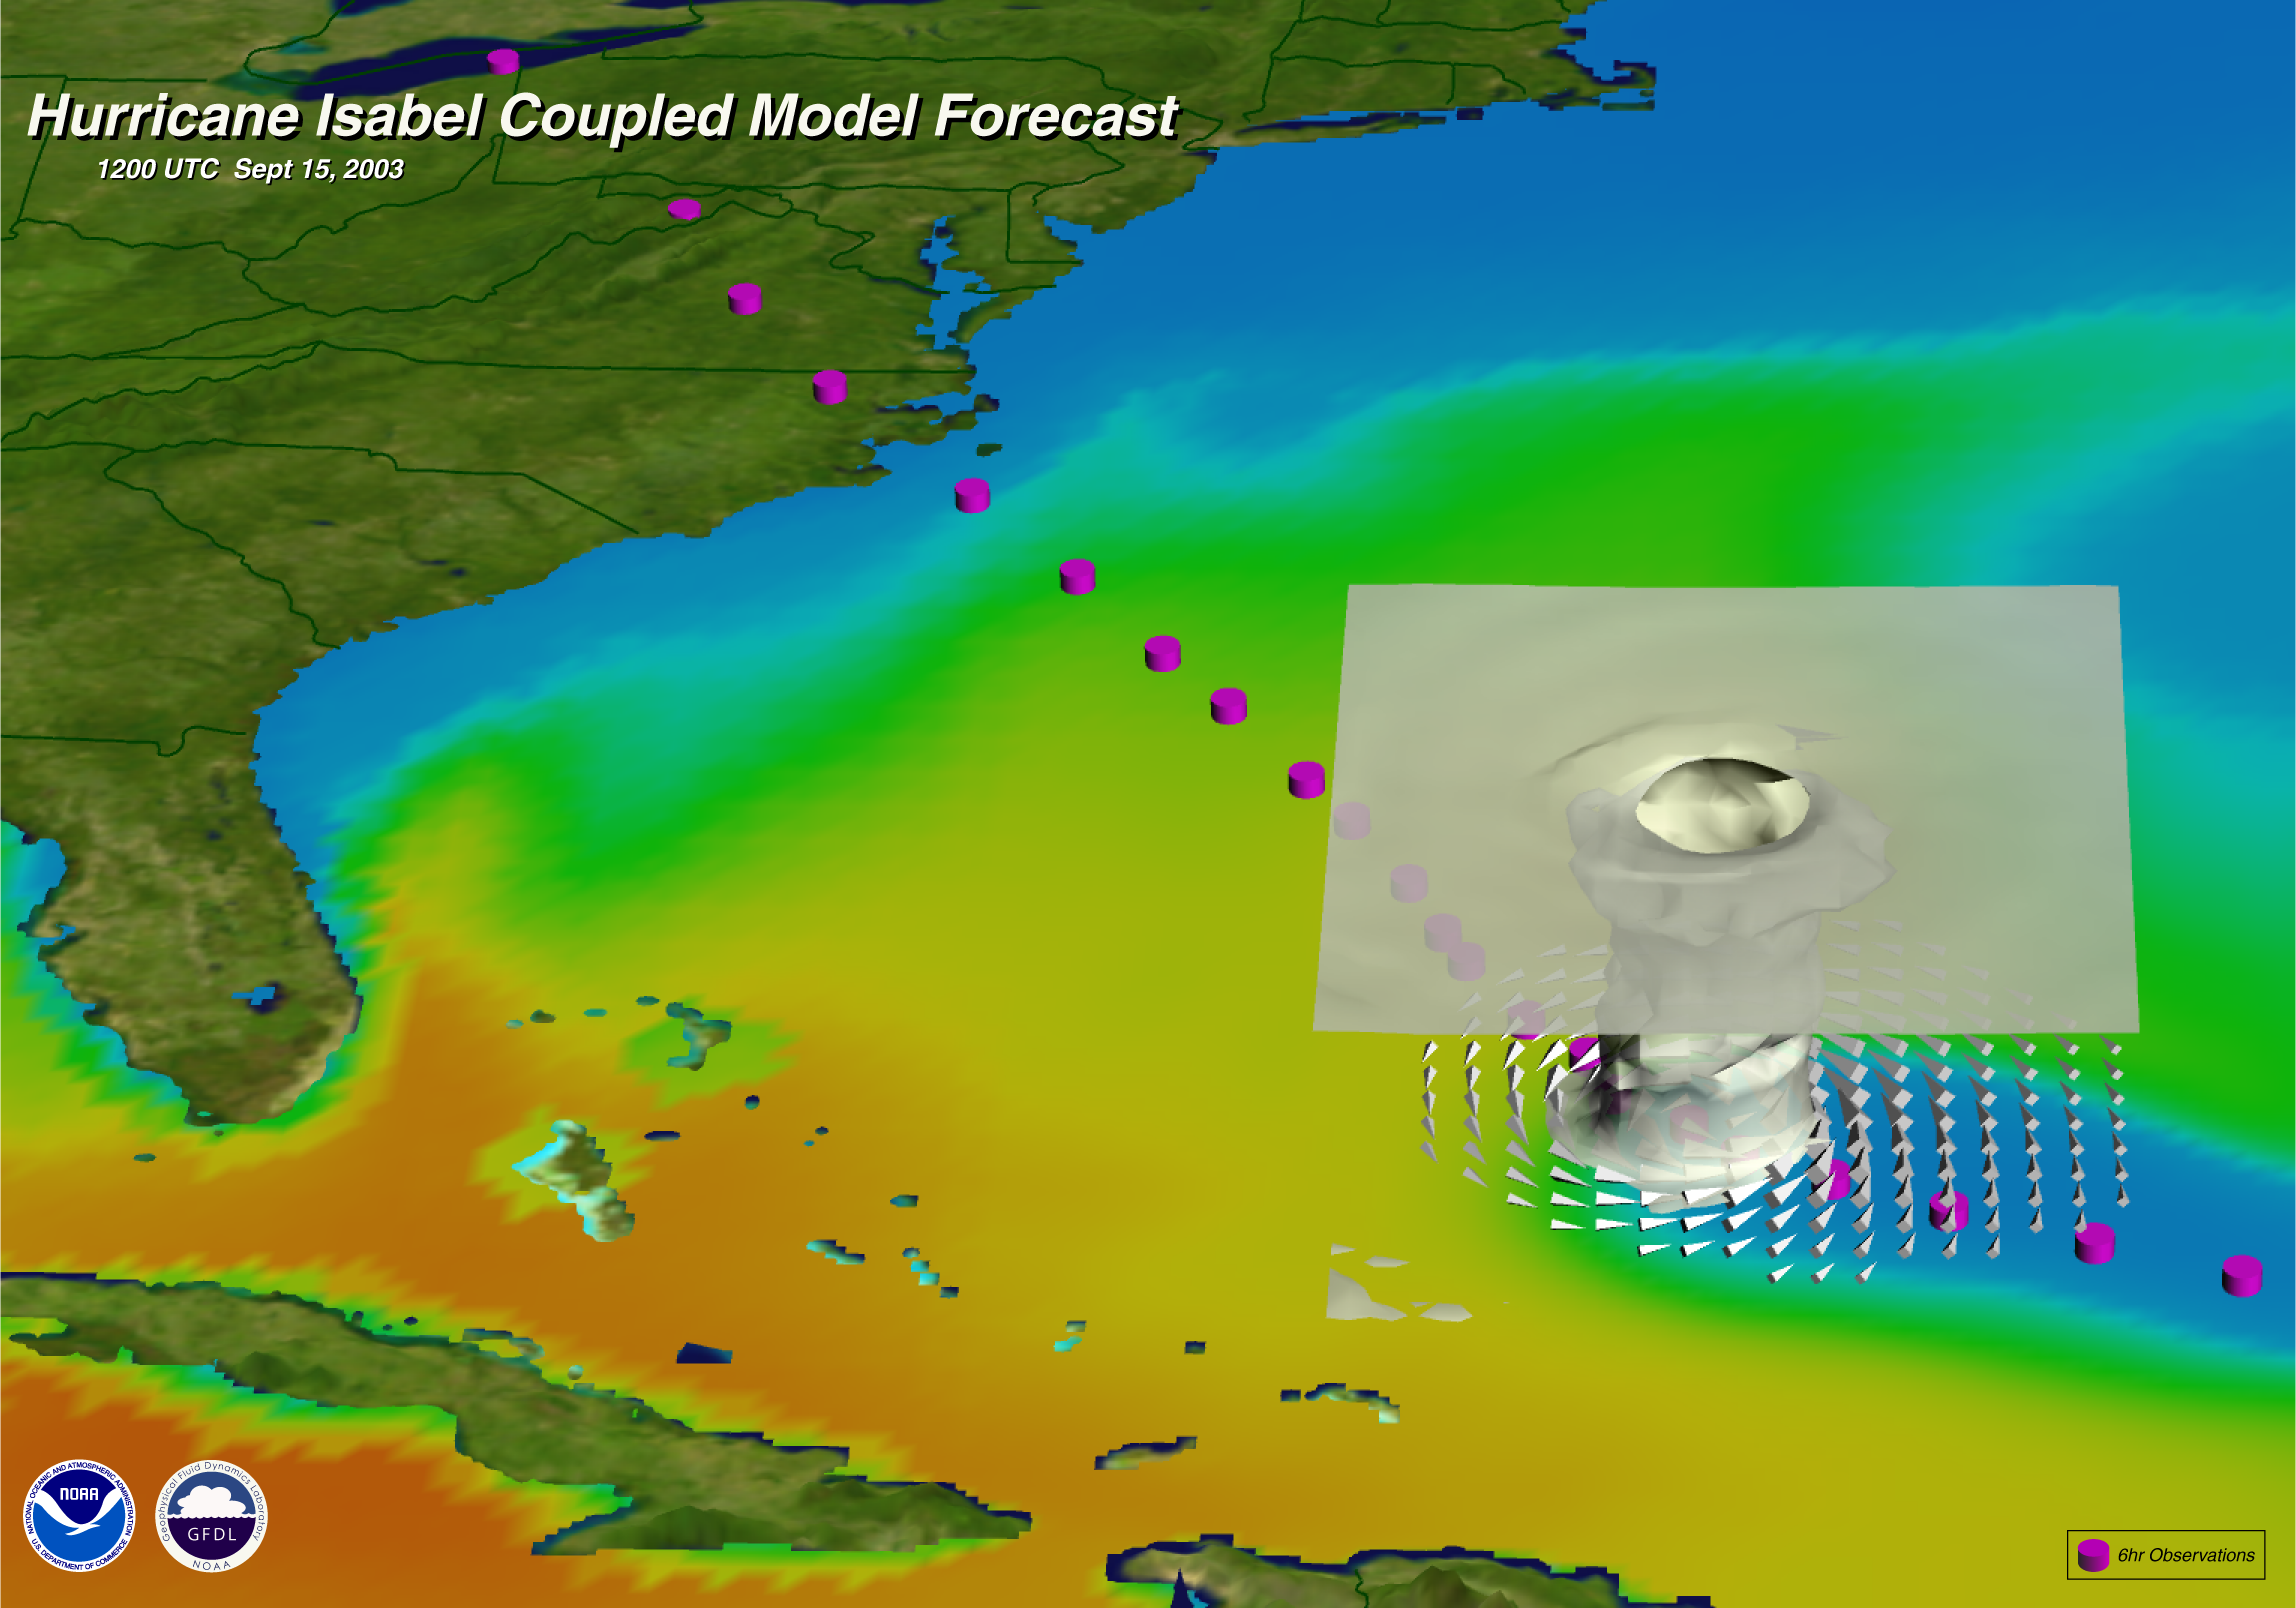
Coupled Model Forecast
This animation illustrates a three-dimensional view of Hurricane Isabel approaching the East Coast of the United States. Results were obtained from a 99-hour forecast made at 8:00am, September 15th using the dynamical Hurricane Prediction System.
Details
Title |
Coupled Model Forecast |
Description |
This animation illustrates a three-dimensional view of Hurricane Isabel approaching the East Coast of the United States. Results were obtained from a 99-hour forecast made at 8:00am, September 15th using the dynamical Hurricane Prediction System developed at NOAA’s Geophysical Fluid Dynamic Laboratory (GFDL). Hurricane Isabel, which struck the Outer Banks of North Carolina on September 19th, 2003, caused extensive damage over a large area of the mid-Atlantic coast stretching from North Carolina to northern Virginia.
The animation displays the 350K isosurface (light-colored sheet) of “equivalent potential temperature”, which measures the combined effects of heat and moisture and is therefore a fundamental quantity of hurricanes, a heat engine-like phenomena dependent on warm, moist tropical oceans and cumulus heating. The white arrows indicate wind speed and direction near the earth’s surface. As the hurricane’s strong winds move across the ocean the cooler waters from below are brought up to the surface resulting in significant decrease in the sea surface temperature. Since the 2000 hurricane season this effect has been included in the operational GFDL model, by coupling the atmospheric model to the Princeton Ocean Model. This effect can clearly be seen in the animation, with a wake of cooler waters trailing the storm, indicated by the blue colors. Inclusion of the ocean coupling is important for the hurricane model to properly forecast the storm’s intensity. Since 1995, the GFDL model has provided forecast guidance of track and intensity for forecasters at the National Hurricane Center. In 2003, the model’s vertical resolution and physics was significantly upgraded and the forecast guidance has been extended out to 5 days. So far this season, the improved GFDL model has outperformed all other computer guidance. |
Model name |
GFDL Operational Hurricane Model |
Scientist(s) |
Morris Bender |
Date Created |
2003-09 |
Visualization personnel |
Remik Ziemlinski,Hans Vahlenkamp, John Sheldon |
Files |
MPEG (34.4MB) AVI (31.1MB) PNG (1.5MB) |
Coupled Model Relative Humidity
An animation of the Coupled Model’s relative humidity parameter may be seen against the true observed locations.
Details
Title |
Coupled Model Relative Humidity |
Description |
An animation of the Coupled Model’s relative humidity parameter may be seen against the true observed locations. |
Model name |
GFDL Operational Hurricane Model |
Scientist(s) |
Morris Bender |
Date Created |
2003-09 |
Visualization personnel |
Remik Ziemlinski, Hans Vahlenkamp, John Sheldon |
Files |
AVI (4.9MB) PNG (216KB) |
Title |
GOES Infra-Red Tracking (CONUS) |
Description |
GOES satellite imagery animation of Continental U.S. |
Model name |
GFDL Operational Hurricane Model |
Scientist(s) |
|
Date Created |
2003-09 |
Visualization personnel |
Remik Ziemlinski, Hans Vahlenkamp, John Sheldon |
Files |
AVI (4.9MB) PNG (216KB) |

Title |
GOES Infra-Red Tracking (Atlantic) |
Description |
GOES satellite imagery animation of U.S. Atlantic coast. |
Model name |
GFDL Operational Hurricane Model |
Scientist(s) |
Morris Bender |
Date Created |
2003-09 |
Visualization personnel |
Remik Ziemlinski, Hans Vahlenkamp, John Sheldon |
Files |
AVI (23.4MB) PNG (233KB) |
Floyd (1999)
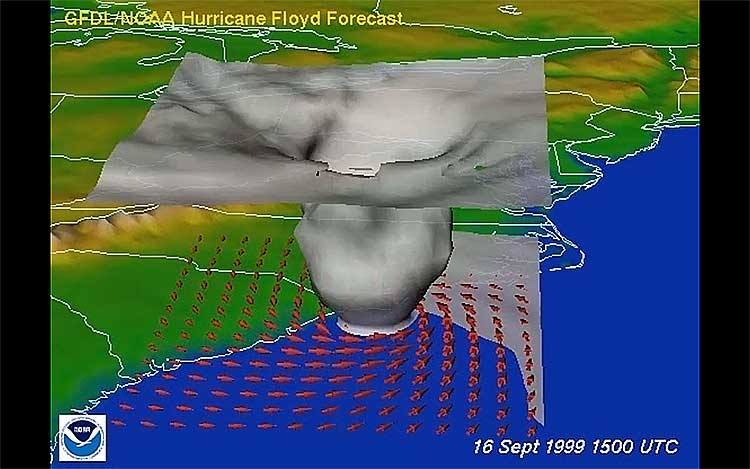
GFDL Operational Hurricane Model Forecast of Floyd
Three-dimensional view of Hurricane Floyd as it approached landfall at Cape Fear on September 16, 1999.
Details
Title |
GFDL Operational Hurricane Model Forecast of Floyd |
Description |
Three-dimensional view of Hurricane Floyd as it approached landfall at Cape Fear on September 16, 1999. Results were obtained from a forecast made using the dynamical Hurricane Prediction System developed at NOAA’s Geophysical Fluid Dynamic Laboratory (GFDL) and adopted as the official operational hurricane prediction model at the National Centers for Environmental Prediction (formerly the National Meteorological Center) starting with the 1995 hurricane season. The model correctly forecast the path of Floyd up the East Coast of the United States.
In the figure, winds in excess of gale force are indicated by the magenta and white arrows at the surface and top of the storm, respectively. The color shading at the earth’s surface represents the precipitation, with red indicating higher intensities. The gray three-dimensional “cloud-like” feature is the 80% relative humidity surface, cut away on its eastern side to reveal the hurricane’s interior structure, including the tube-like eye down the center. The horizontal plane slicing through the middle of the storm, and the red vertical arrows, indicate the upward motion in the storm’s interior. Note the north-south asymmetry of the storm, as Floyd gets swept up in the larger-scale southwesterly flow. |
Model name |
GFDL Operational Hurricane Model |
Scientist(s) |
Morris Bender, Timothy Marchok |
Date Created |
2000 |
Visualization personnel |
|
Files |
MPG (8.5MB) AVI (11.8MB) MPG (9.6MB) AVI (10MB) AVI (12.7MB) GIF (294KB) |
Mitch (1998)
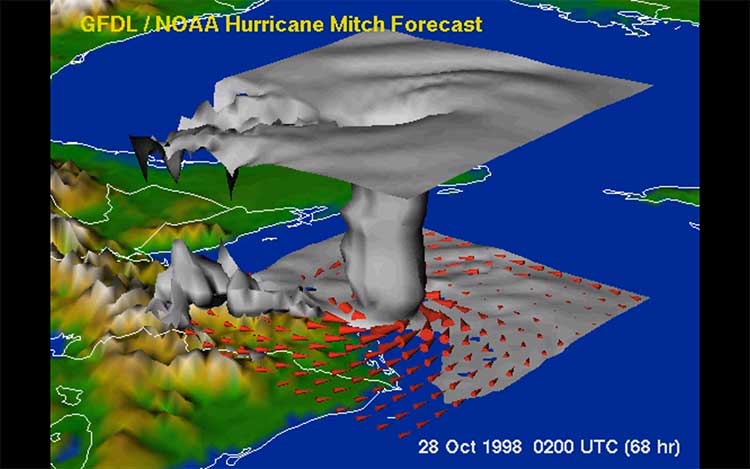
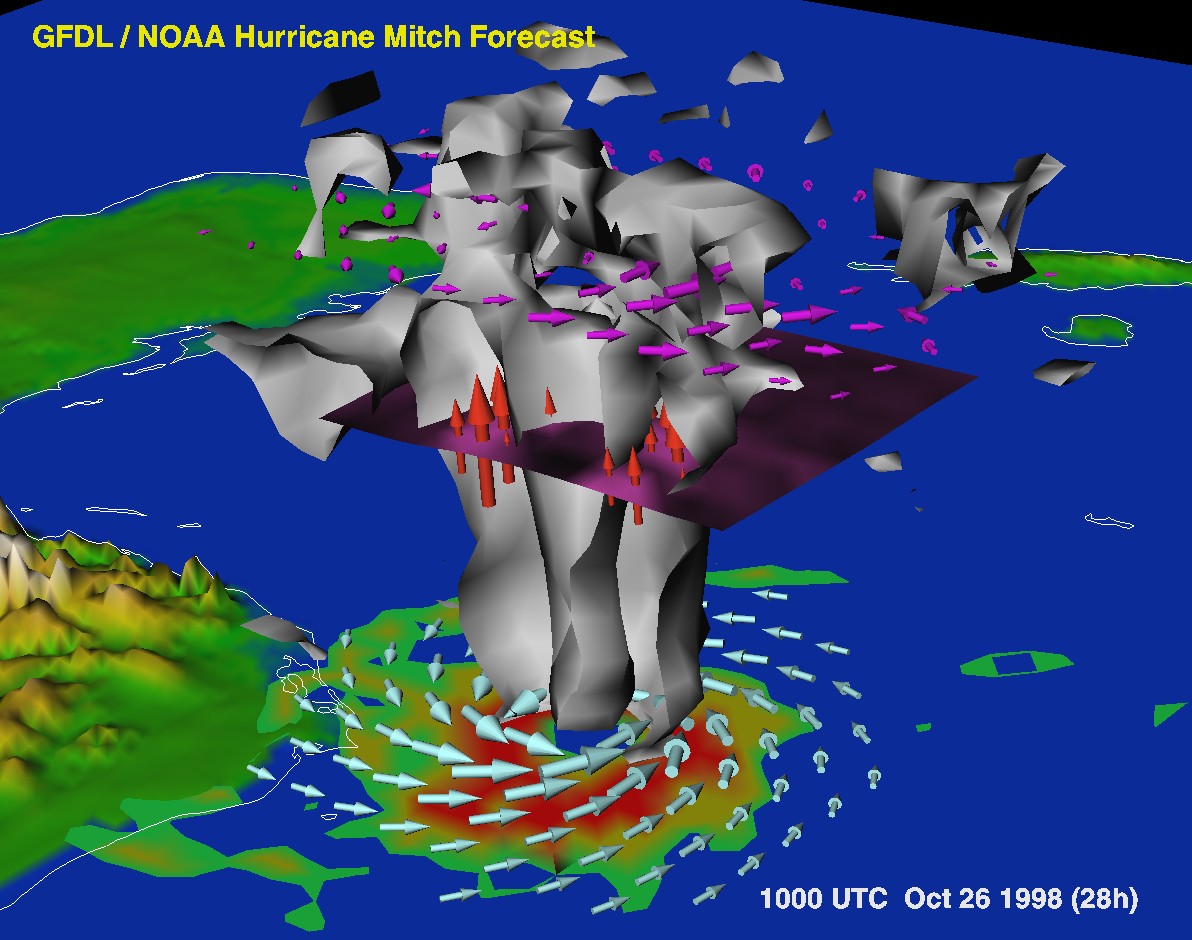
GFDL Operational Hurricane Model Forecast of Mitch
Deadliest hurricane to hit Central America in 200 years. A category 5 storm at one point, Mitch stalled off the coast of Honduras, then slowly moved through Central America, causing massive flooding.
Details
Title |
GFDL Operational Hurricane Model Forecast of Mitch |
Description |
Deadliest hurricane to hit Central America in 200 years. A category 5 storm at one point, Mitch stalled off the coast of Honduras, then slowly moved through Central America, causing massive flooding.
Shown in this diagram are wind vectors (near surface winds). Grey shading indicates particular contour of Equivalent Potential Temperature that highlights the surface inflow layer and eyewall region. |
Model name |
GFDL Operational Hurricane Model |
Scientist(s) |
Morris Bender, Timothy Marchok |
Date Created |
1999 |
Visualization personnel |
|
Files |
AVI (32MB) JPG (199KB) |