Visualizations – Lima Climate Change Conference
|
|
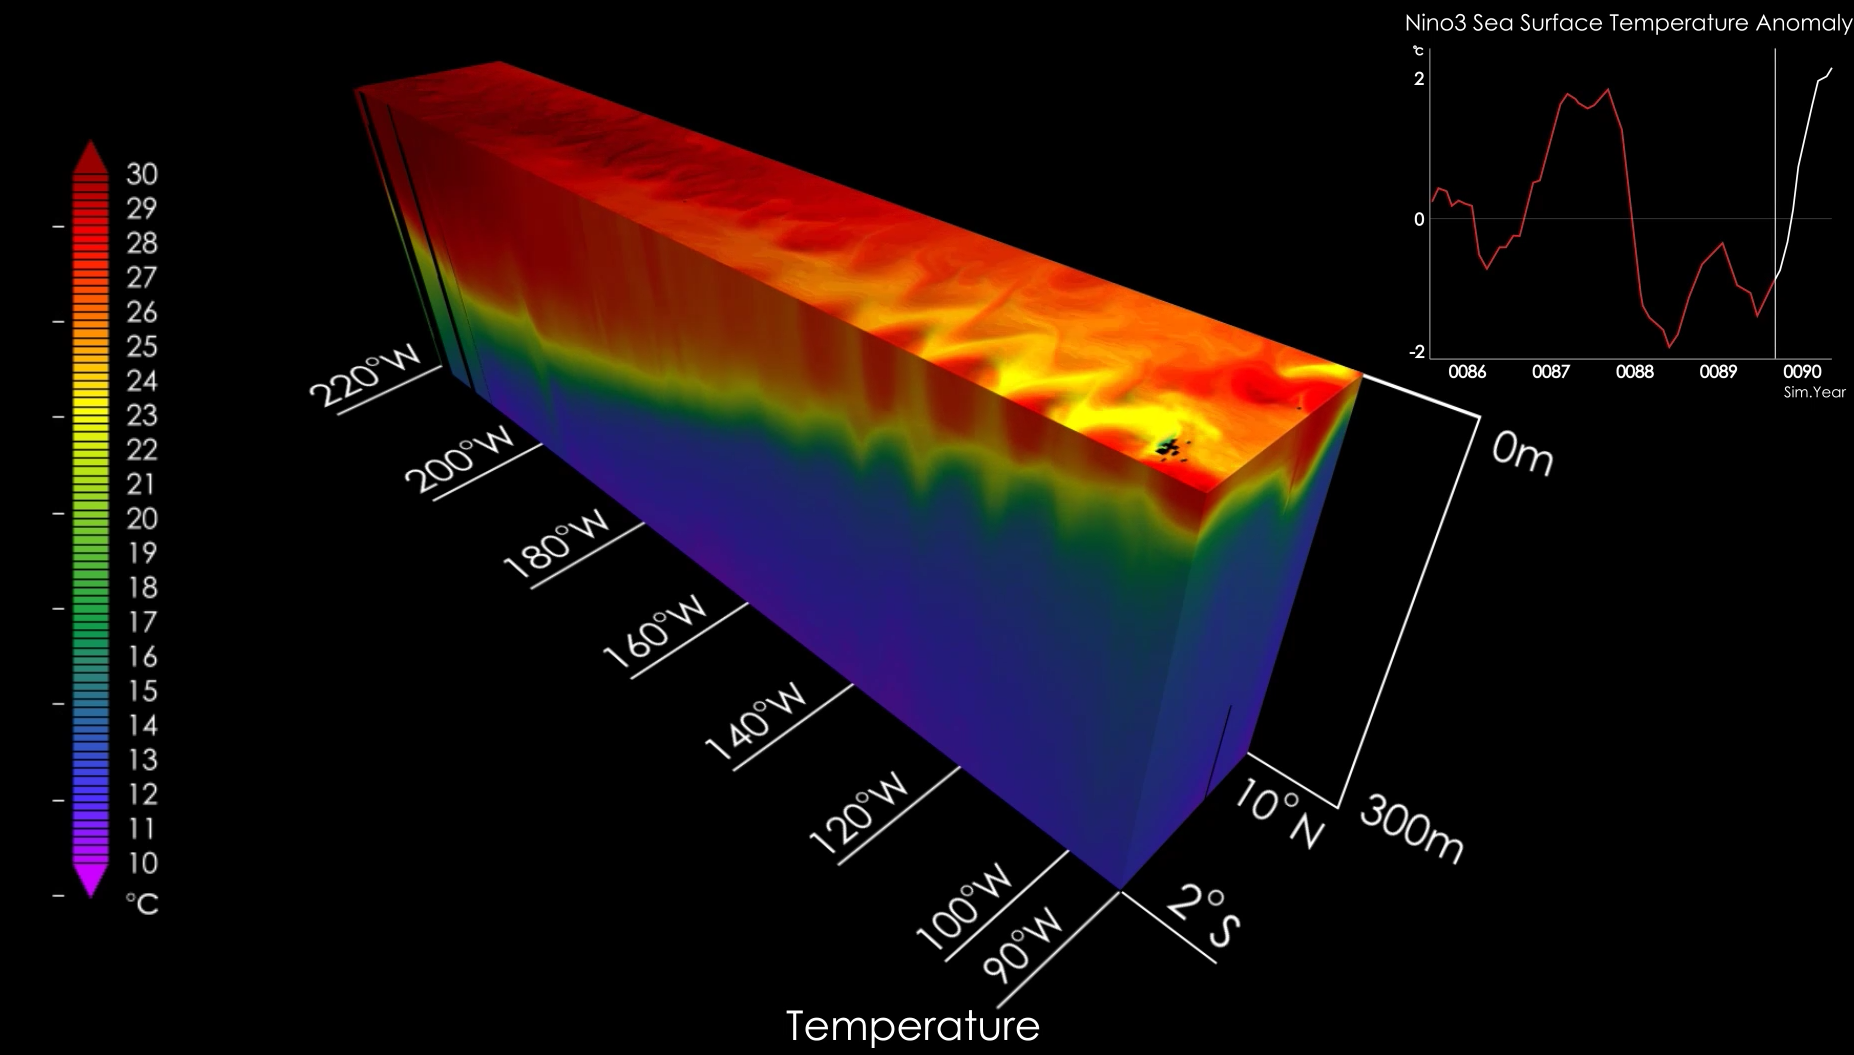
Title | El Nino Simulation with NOAA/GFDL’s CM2.6 High Resolution Coupled Climate Model |
| Description | This animation of model output illustrates the three dimensional complexity which is resolved in this model. A section of the Equatorial Pacific is showcased as it evolves through several ENSO events. Sea surface temperatures are taken from NOAA/GFDL’s CM2.6 High Resolution Coupled Climate Model which has a nominal resolution of 1/2 degree for the land and atmosphere and 1/10 degree for the ocean and ice. The surface temperature are daily output while the subsurface temperatures are interpolated from monthly output. Salient features are the tropical instability waves and their subsurface impact, the evolution of the tropical thermocline through the events and the impacts of the presence of a well represented Galapagos Archipelago. | |
| Model name | NOAA/GFDL’s CM2.6 High Resolution Coupled Climate Model | |
| Scientist(s) | Whit Anderson, Tom Delworth, Tony Rosati, Mike Winton | |
| Date created | November 2014 | |
| Visualization Personnel | Whit Anderson (NOAA/GFDL), Youngrak Cho | |
| Files | MPEG |
|
|
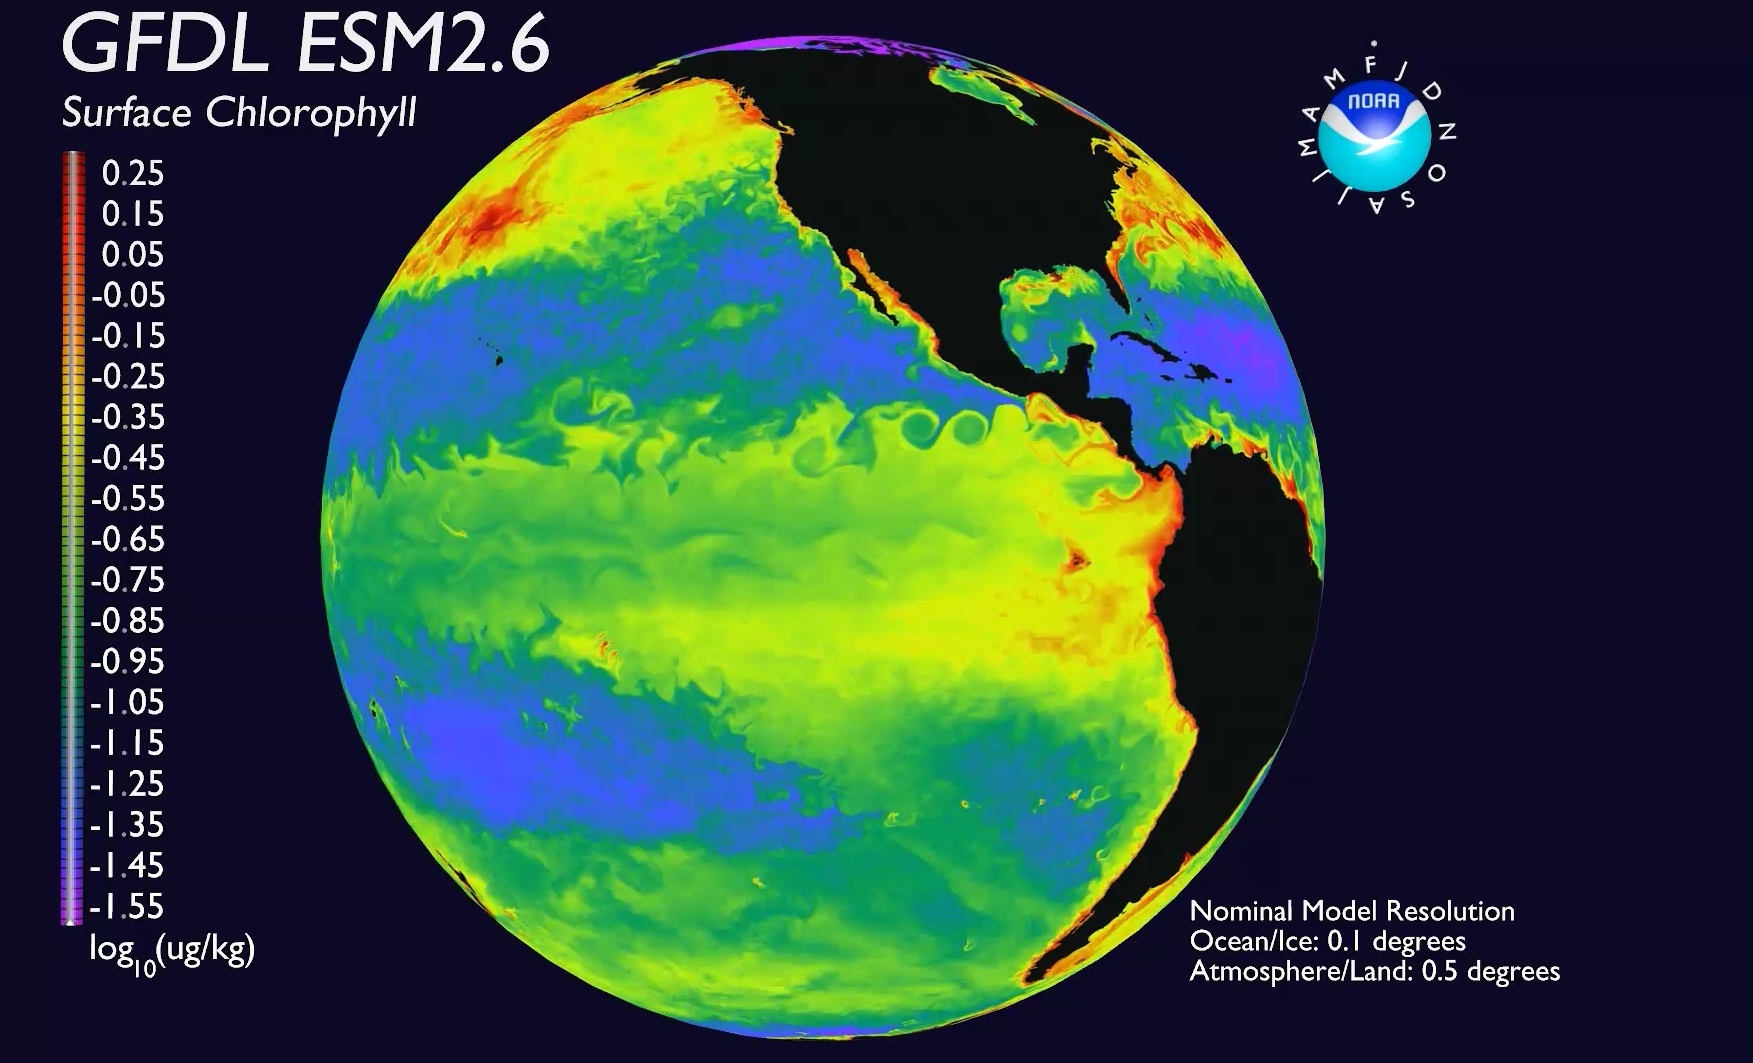
Title | Surface Chlorophyll from NOAA/GFDL’s ESM2.6 High Resolution Earth System Model |
| Description | Daily model output of surface chlorophyll is animated and shown gloablly. This animation highlights the models ability to simulate a biological quantity which has global ramifications on the physical and biological climate systems. The model from which the chlorophyll is taken is the biogeochemically comprehensive Tracers of Ocean Phytoplankton with Allometric Zooplankton (TOPAZ). This model focuses on multi-elemental biogeochemical coupling while sacrificing ecological comprehensiveness through a high degree of ecological empirical parametrization via Dunne et al. (2005). The physical model used to drive TOPAZ in this simulation is NOAA/GFDL’s CM2.6 High Resolution Coupled Climate Model. | |
| Model name | NOAA/GFDL’s CM2.6 High Resolution Coupled Climate Model/TOPAZ | |
| Scientist(s) | Whit Anderson, John Dunne, Charlie Stock | |
| Date created | August 2014 | |
| Visualization Personnel | Whit Anderson (NOAA/GFDL), Youngrak Cho | |
| Files | MPEG |
|
|
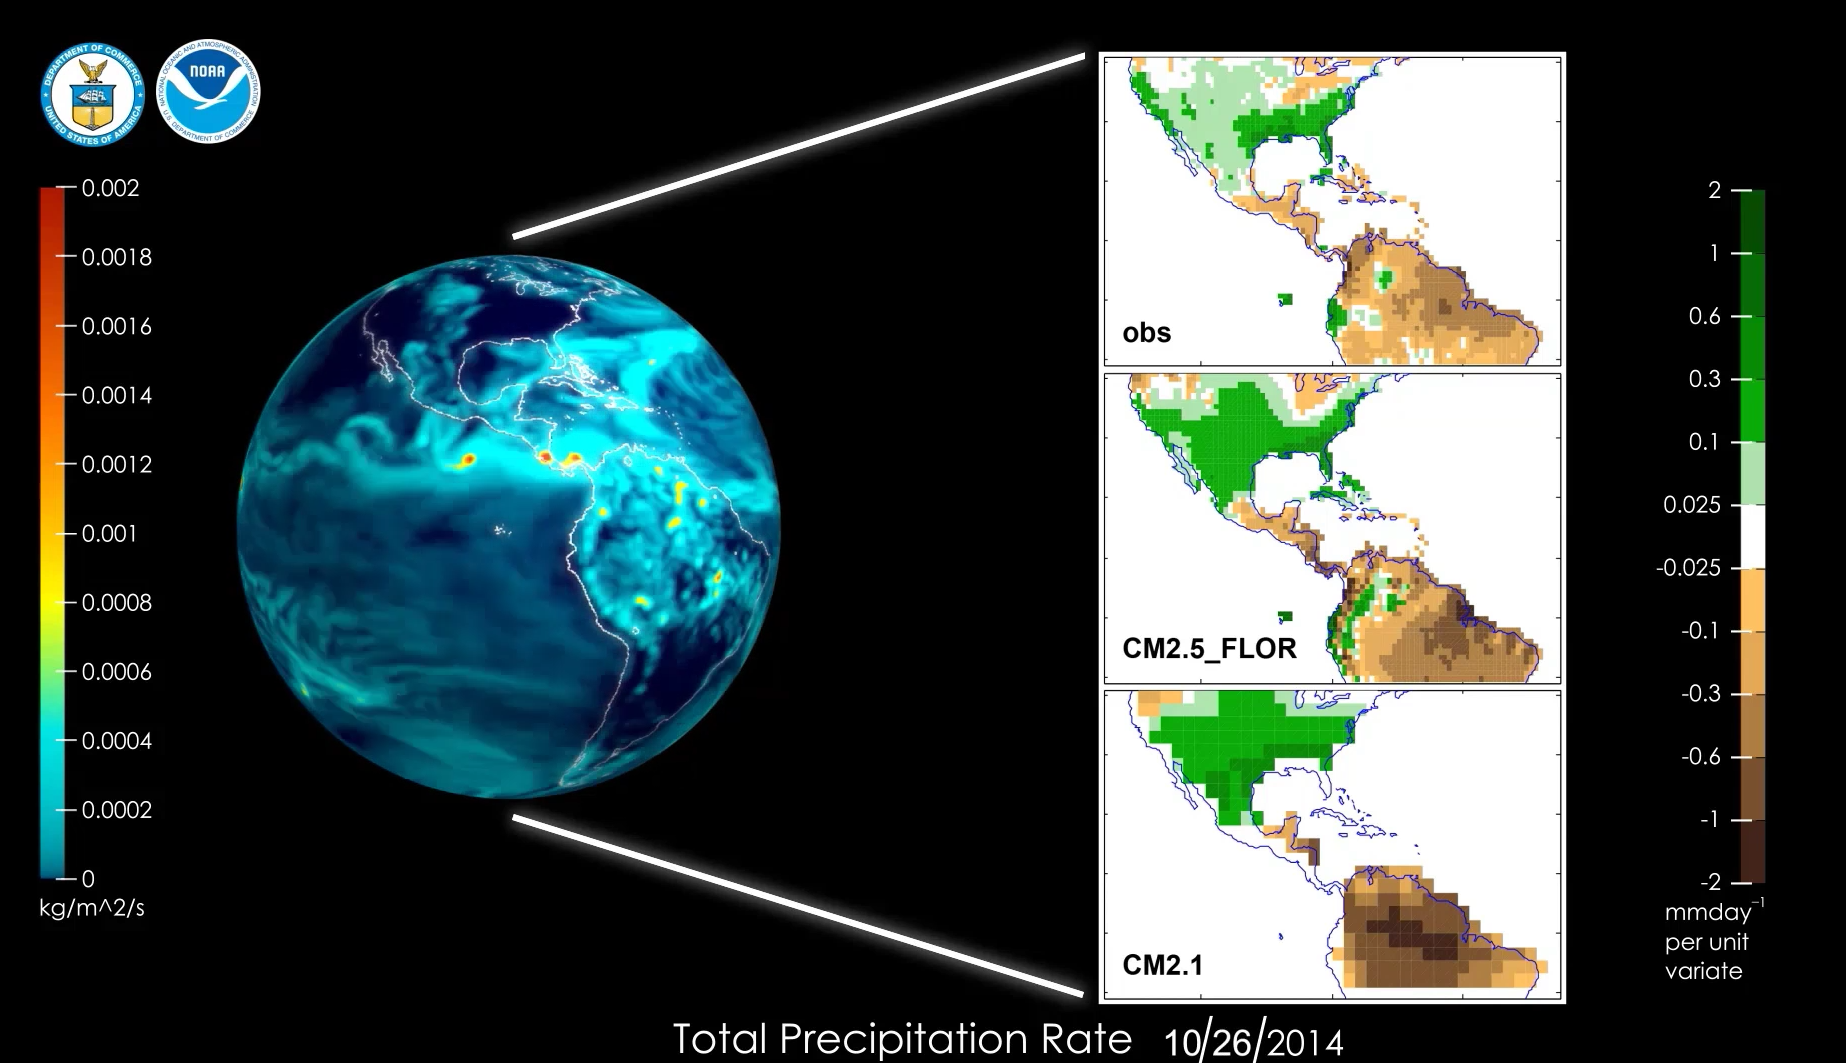
Title | NOAA/GFDLs CM2.5-FLOR (Forecast-oriented Low Ocean Resolution) Forecast System |
| Description | This animation is used to demonstrate the change in solution complexity and model skill when moving from the lower atmosphere resolution CM2.1 Model to the CM2.5-FLOR (Forecast-oriented Low Ocean Resolution) Forecast System. Shown here is a single member from the CM2.5-FLOR model ensemble. The animation showcases the forecast initialized fall 2014 and runs through summer 2015.
|
|
| Model name | NOAA/GFDLs CM2.5-FLOR (Forecast-oriented Low Ocean Resolution) Forecast System. | |
| Scientist(s) | Whit Anderson, Tom Delworth, Tony Rosati, Gabriel Vecchi | |
| Date created | December 2014 | |
| Visualization Personnel | Whit Anderson (NOAA/GFDL), Youngrak Cho | |
| Files | MPEG |
|
|
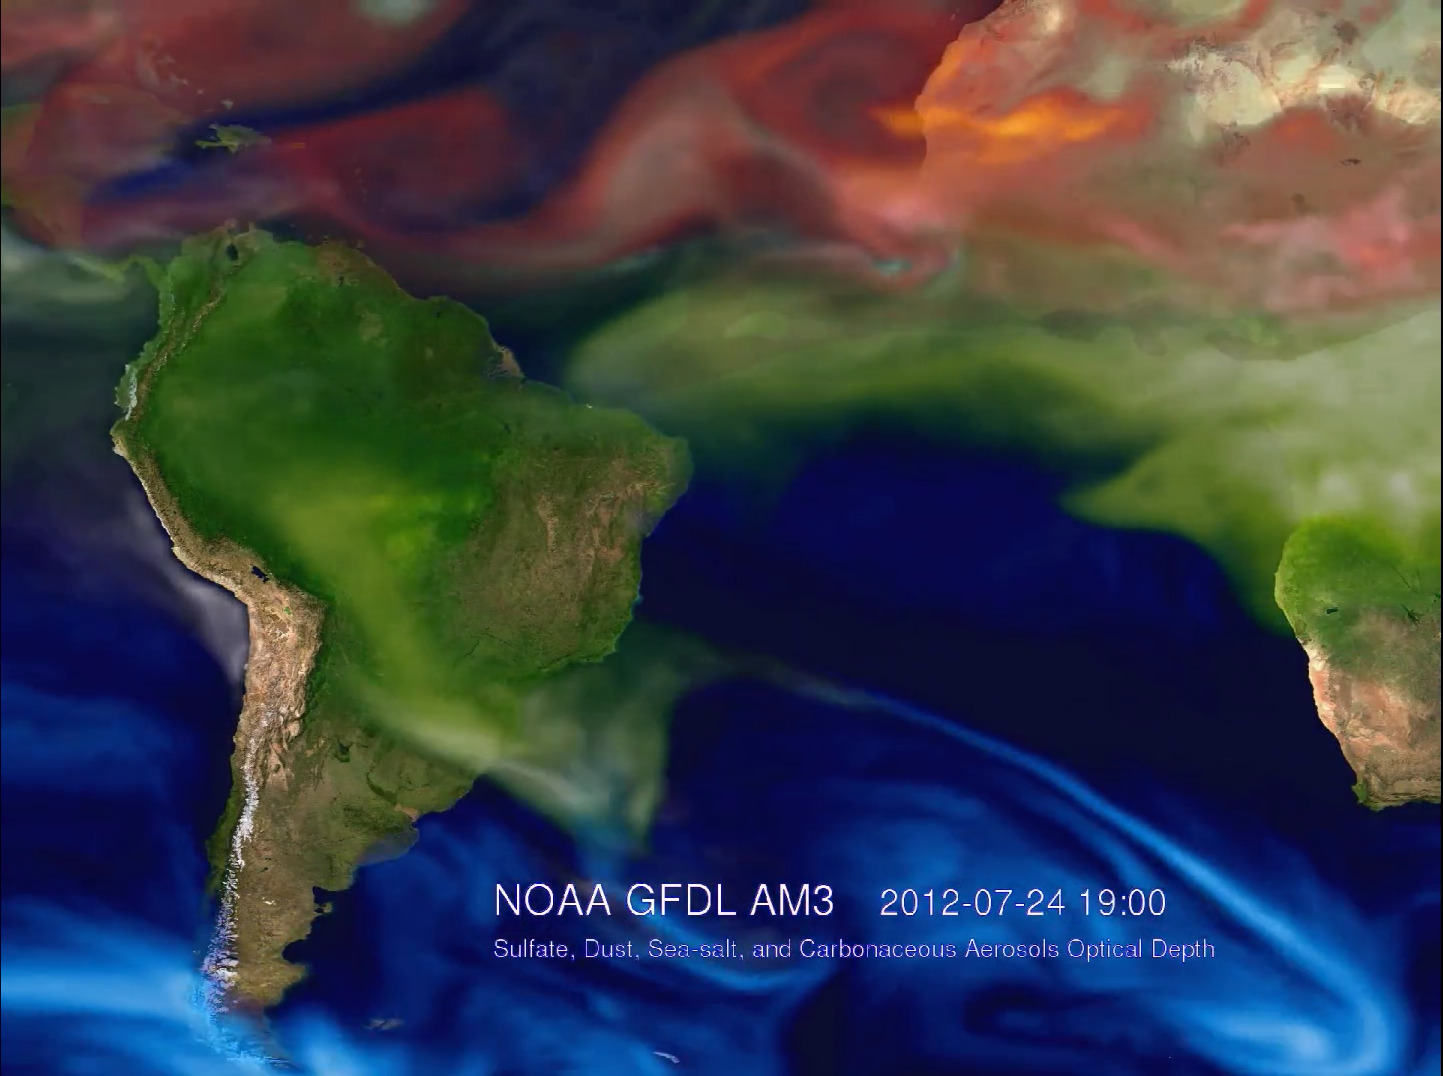
Title | Animation of Aerosol Optical Depth for June-July-August 2012 simulated with the NOAA GFDL Atmospheric Model |
| Description | Dust is emitted from natural and anthropogenic sources, with a nice example of anthropogenic dust event over US generated from crop fields in Western Nebraska on October 18 and reaching the East coast on October 20, 2012. And one week later (near the end of the movie) Hurricane Sandy is generating a large amount of sea salt along the East coast of the US. | |
| Model name | GFDL high resolution AM3.1 model | |
| Scientist(s) | Paul Ginoux | |
| Date created | December 2014 | |
| Visualization Personnel | Realisation: Paul Ginoux (NOAA GFDL); Graphical Program: Arlindo da Silva (NASA GSFC); Animation: Paidemwoyo Munhutu (NOAA GFDL & DRC); Blue Marble from NASA Visible Earth. | |
| Files | MPEG |