

Data Visualizations – Mesoscale Dynamics
These animations are offered as examples of scientific research results, to convey complex information in graphic form.
Redistribution of these materials is permitted, but we ask that NOAA/GFDL be credited as the source, and that we be informed of the usage. Please also see our Disclaimers and Privacy Policy. You can also create visualizations with some of GFDL’s climate data using NOAA’s data exploration tool, NOAAView.
For questions, please contact oar.gfdl.communications@noaa.gov
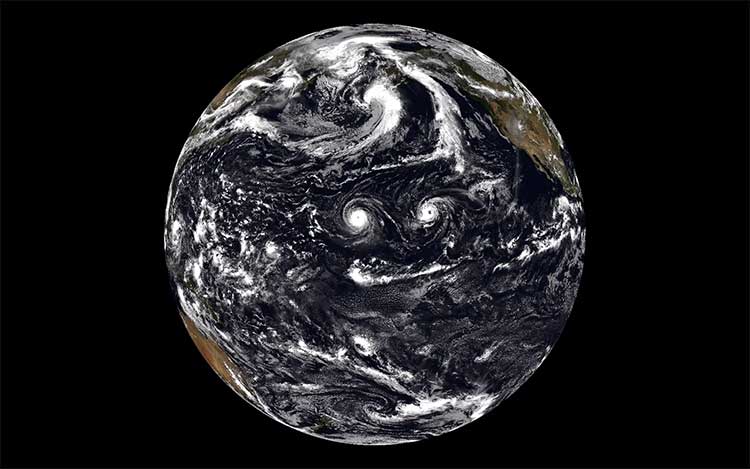
Total cloud condensate simulated by the global cloud-resolving FV3
This animation illustrates the hourly column integrated total cloud condensate (sum of cloud liquid water, cloud ice, rain, snow, and graupel) from the global 3-km FV3 (Finite Volume Cubed-Sphere Dynamical Core).
Details
Title |
Total cloud condensate simulated by the global cloud-resolving FV3 |
Description |
This animation illustrates the hourly column integrated total cloud condensate (sum of cloud liquid water, cloud ice, rain, snow, and graupel) from the global 3-km FV3 (Finite Volume Cubed-Sphere Dynamical Core). Due to its high parallel computing efficiency, the non-hydrostatic FV3 can take full advantage of NOAA’s High Performance Computing system known as GAEA, by discretizing the full earth into over 4 billion computational cells. At such fine resolution of approximately three by three km columns, previously unresolvable physics processes, such as the “deep convection”, can be directly and more faithfully simulated by the non-hydrostatic dynamics and the embedded cloud microphysics. Severe weather events, such as the landfalling hurricanes, tropical cloud clusters, can be predicted with improved accuracy and high fidelity – comparable to the most advanced high-resolution satellite imageries. |
Model name |
FV3 |
Scientist(s) |
Shian-Jiann Lin, Xi Chen and Linjiong Zhou |
Date Created |
April 3, 2018 |
Visualization personnel |
Xi Chen |
Files |
Frame-by-frame 1080p GIF MP4 1080p |
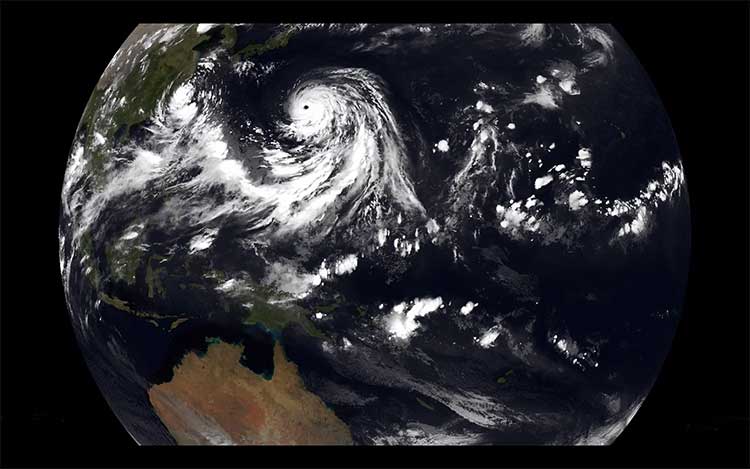
Outgoing Longwave Radiation Simulated by the Global Cloud-Resolving FV3
This animation illustrates the hourly outgoing longwave radiation (OLR) field from the global 3-km FV3 (Finite Volume Cubed-Sphere Dynamical Core).
Details
Title |
Outgoing Longwave Radiation Simulated by the Global Cloud-Resolving FV3 |
Description |
This animation illustrates the hourly outgoing longwave radiation (OLR) field from the global 3-km FV3 (Finite Volume Cubed-Sphere Dynamical Core). Due to its high parallel computing efficiency, the non-hydrostatic FV3 can take full advantage of NOAA’s High Performance Computing system known as GAEA, by discretizing the full earth into over 4 billion computational cells. At such fine resolution of approximately three by three km columns, previously unresolvable physics processes, such as the “deep convection”, can be directly and more faithfully simulated by the non-hydrostatic dynamics and the embedded cloud microphysics. Severe weather events, such as the landfalling hurricanes, tropical cloud clusters, can be predicted with improved accuracy and high fidelity – comparable to the most advanced high-resolution satellite imageries. |
Model name |
FV3 |
Scientist(s) |
Shian-Jiann Lin, Xi Chen and Linjiong Zhou |
Date Created |
April 3, 2018 |
Visualization personnel |
Xi Chen |
Files |
Frame-by-frame 1080p GIF MP4 1080p |
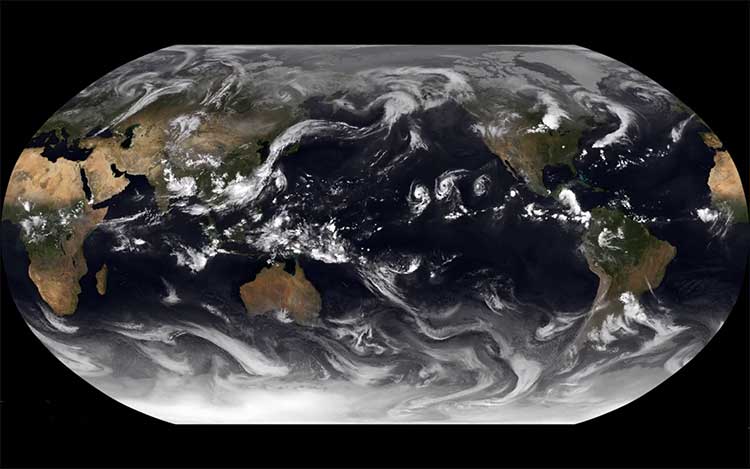
Outgoing Longwave Radiation Simulated by the Global Cloud-Resolving FV3 In The Robinson Map Projection
This animation illustrates the hourly outgoing longwave radiation (OLR) field plotted in the Robinson map projection from the global 3-km FV3 (Finite Volume Cubed-Sphere Dynamical Core).
Details
Title |
Outgoing Longwave Radiation Simulated by the Global Cloud-Resolving FV3 |
Description |
This animation illustrates the hourly outgoing longwave radiation (OLR) field plotted in the Robinson map projection from the global 3-km FV3 (Finite Volume Cubed-Sphere Dynamical Core). Due to its high parallel computing efficiency, the non-hydrostatic FV3 can take full advantage of NOAA’s High Performance Computing system known as GAEA, by discretizing the full earth into over 4 billion computational cells. At such fine resolution of approximately three by three km columns, previously unresolvable physics processes, such as the “deep convection”, can be directly and more faithfully simulated by the non-hydrostatic dynamics and the embedded cloud microphysics. Severe weather events, such as the landfalling hurricanes, tropical cloud clusters, can be predicted with improved accuracy and high fidelity – comparable to the most advanced high-resolution satellite imageries. |
Model name |
FV3 |
Scientist(s) |
Shian-Jiann Lin, Xi Chen and Linjiong Zhou |
Date Created |
April 3, 2018 |
Visualization personnel |
Xi Chen |
Files |
Frame-by-frame 1080p GIF MP4 1080p |
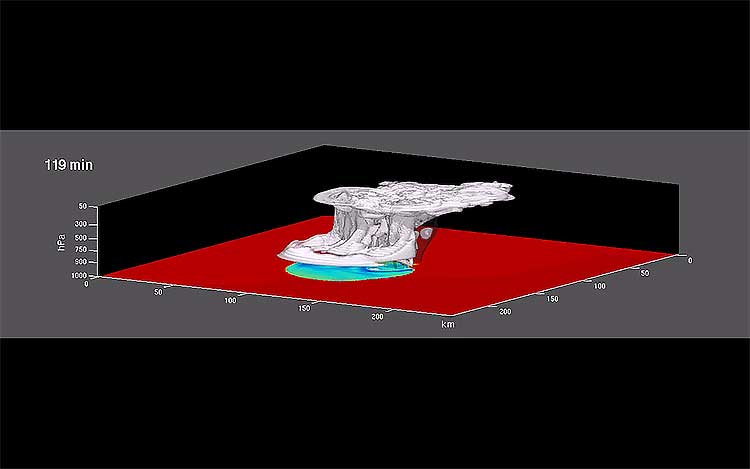
Supercell thunderstorm and tornadoes in the GFDL global model
Simulating a severe supercell thunderstorm is a difficult test of a cloud-scale weather model. A model begins with an atmosphere with a temperature profile that is conducive to thunderstorm development, and winds that allow the storm to maintain itself over several hours and to split into a pair of counter-rotating updrafts.
Details
Title |
Supercell thunderstorm and tornadoes in the GFDL global model |
Description |
Simulating a severe supercell thunderstorm is a difficult test of a cloud-scale weather model. A model begins with an atmosphere with a temperature profile that is conducive to thunderstorm development, and winds that allow the storm to maintain itself over several hours and to split into a pair of counter-rotating updrafts.
This test is not typically done in global models since their grid spacing is too large to be able to resolve thunderstorms. We use a special version of the GFDL global climate model for this test case. First, a 20-km global base grid (c512) is deformed so that the resolution is gradually increased to 1 km over a 500 km by 500 km region (roughly the size of Oklahoma). Second, most of the non-essential (for supercell storms) physical parameterizations are removed, leaving only liquid-phase rain- and cloud-water physics. In particular, there is no radiative heating or cooling, and no surface drag or fluxes. Third, we remove the “hydrostatic” approximation of no explicit vertical accelerations, appropriate in most climate models, to allow strong vertical motions—such as those in thunderstorms—to occur. Within a few minutes of the start of the animation, an updraft has formed, creating a cumulonimbus cloud (white shading) with a visible rain shaft (dark shading). By 55 minutes the storm splits in two supercells, and soon afterwards tornadoes can be seen on the outward edge of the storms’ cold outflows (blue surface shading). At 80 minutes, a mature pair of storms is seen, with multiple tornadoes, a spreading anvil, and substantial regions of rain in both the central convective region and in the stratiform region under the anvil. |
Model name |
GFDL Super High-Resolution Atmosphere Model (Super HiRAM) |
Scientist(s) |
Shian-Jiann Lin and Lucas Harris |
Date Created |
November 29, 2013 |
Visualization personnel |
Lucas Harris |
Files |
AVI (1.5MB) |
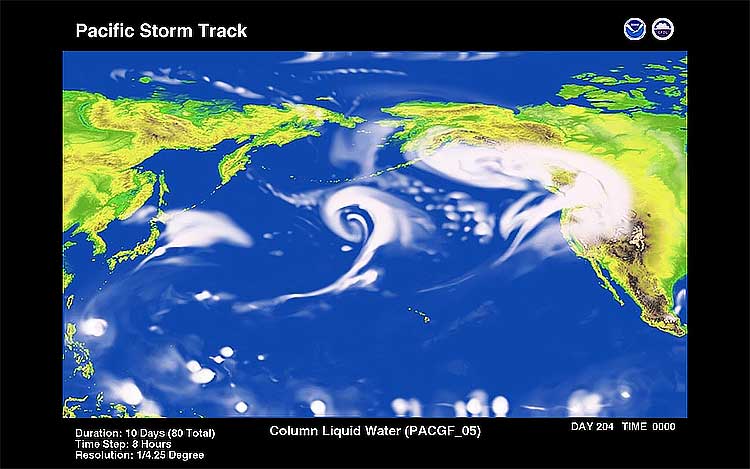
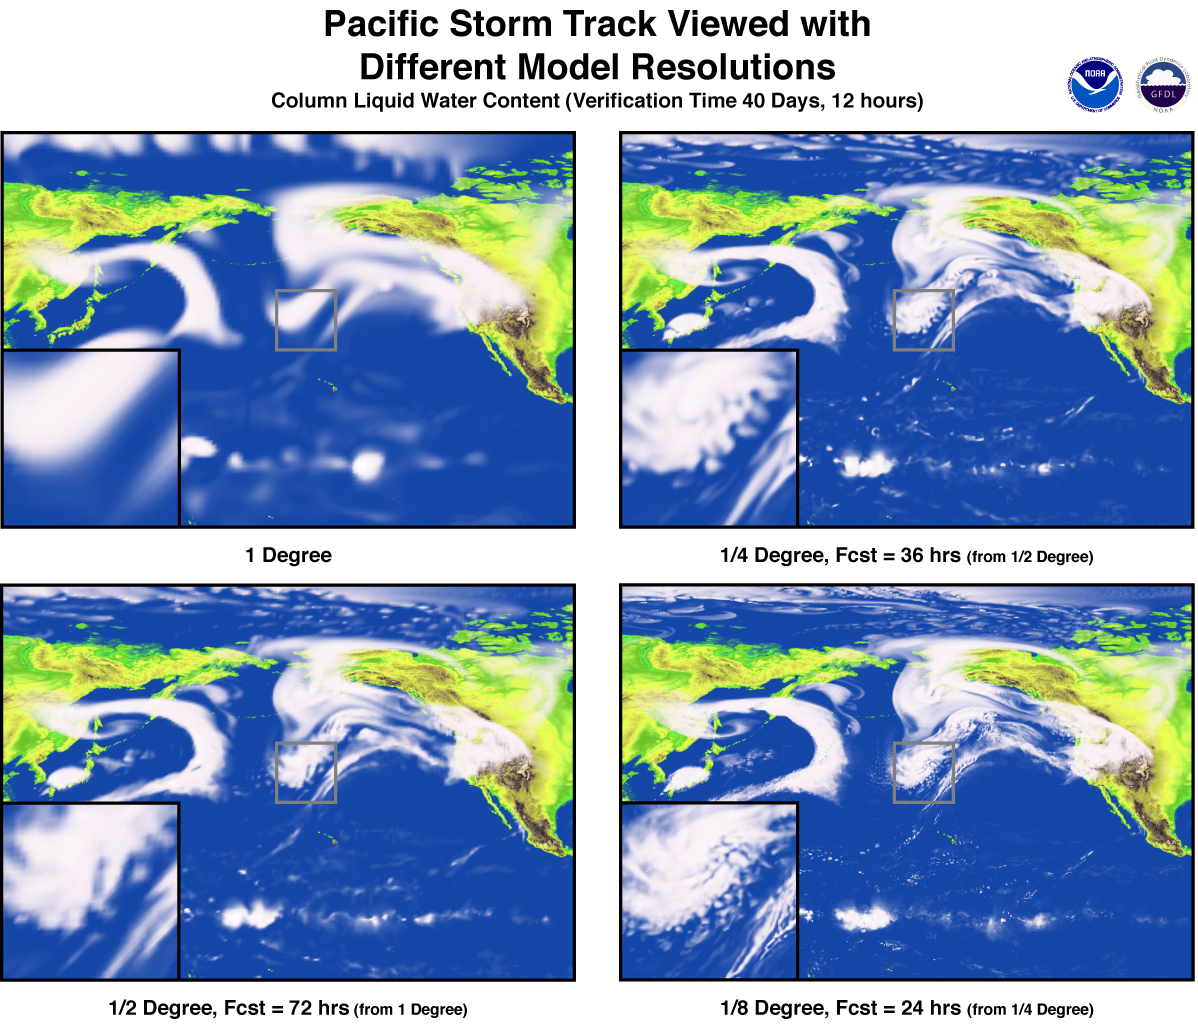
Pacific Storm Track
Developed at GFDL, ZETANC is a high resolution, non-hydrostatic, fully compressible model of hemispheric extent. The model is being used for the simulation of the…
Details
Title |
Pacific Storm Track |
Description |
Developed at GFDL, ZETANC is a high resolution, non-hydrostatic, fully compressible model of hemispheric extent. The model is being used for the simulation of the detailed structure of extra-tropical storms and storm tracks. The studies are aimed in particular at a more definitive understanding of the effects of moist convection on storm structure and evolution. These simulations will be used to evaluate parameterizations in global climate models. The model will also will be used to study the seasonal cycle and inter-annual variability of the storm tracks and their sensitivity to climate change, placing particular emphasis on extreme extra-tropical weather. ZETANC could be used to simulate phenomena at any meteorological scale since it does not require the standard restricted assumptions. In order to illustrate the versatility of the model, two extreme experiments are shown: a) Bubble convection in an isentropic environment, and b) the life-cycle of baroclinic eddies. |
Model name |
|
Scientist(s) |
|
Date Created |
|
Visualization personnel |
|
Files |
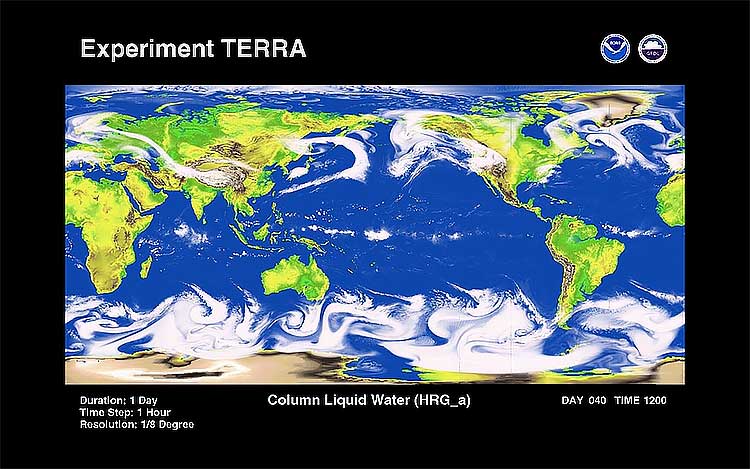
TERRA HRG_a
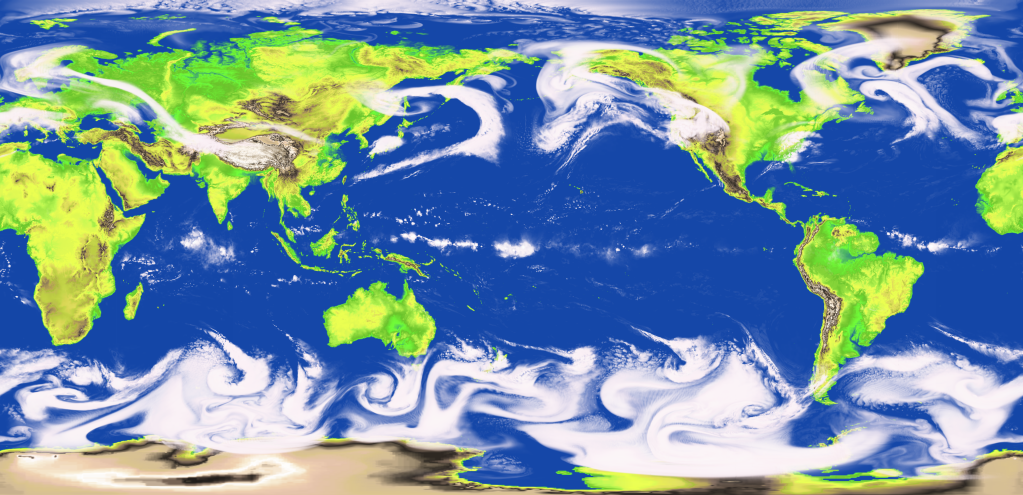
A stand alone explicit convection ZETAC model simulation was done for the globe with an astonishing averaged grid resolution of about 10-12 km. To compare the resolution of these cases with present GMCM’s (Global Mesoscale Circulation Models), it’s better than an N770 or a spectral T1400.
Title |
Supercell thunderstorm and tornadoes in the GFDL global model |
Description |
A stand alone explicit convection ZETAC model simulation was done for the globe with an astonishing averaged grid resolution of about 10-12 km. To compare the resolution of these cases with present GMCM’s (Global Mesoscale Circulation Models), it’s better than an N770 or a spectral T1400. This 24 hour high-resolution experiment (TERRA HRG_a) is visualized below, in addition to lower resolution experiments that have been simulated for up to 80 days total (TERRA HRG_00). Limited region experiments applicable to Pacific Storm Tracking are also presented below. |
Model name |
|
Scientist(s) |
Isidoro Orlanski, Steve Garner, Christopher Kerr |
Date Created |
July 2003 |
Visualization personnel |
Remik Ziemlinski |
Files |
1/8 Degree AVI (3.2MB) PNG (701KB) |
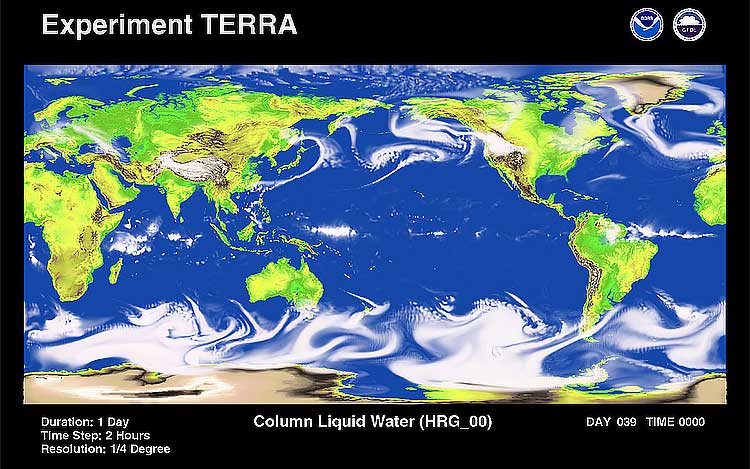
TERRA HRG_00
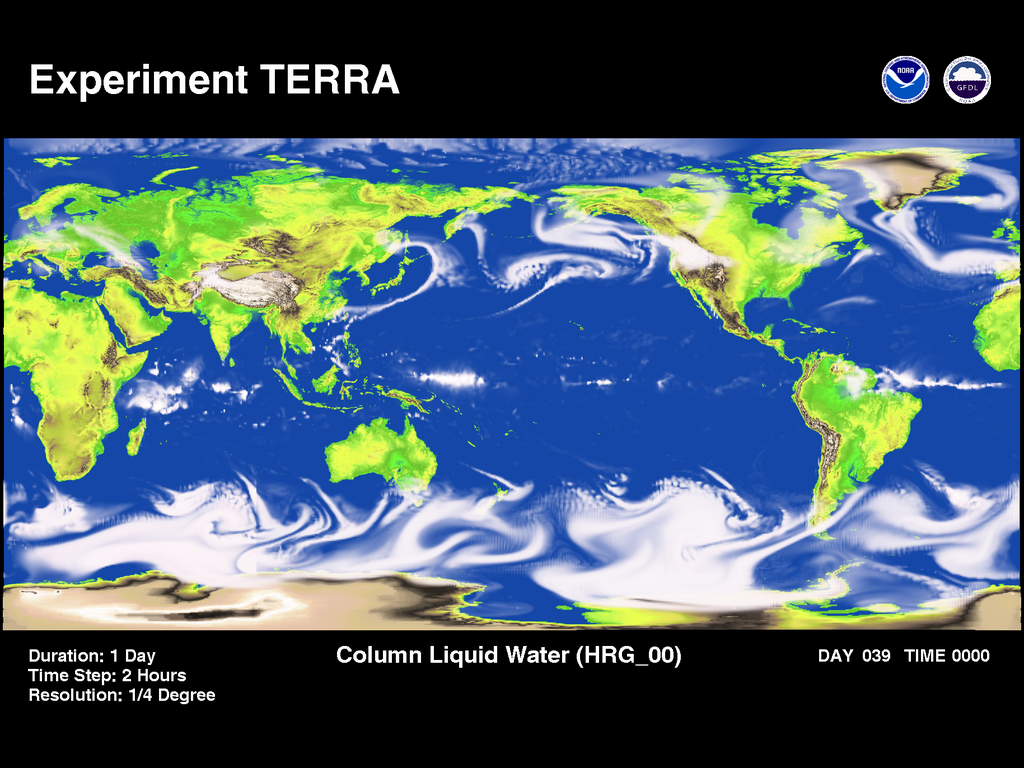
A stand alone explicit convection ZETAC model simulation was done for the globe with an astonishing averaged grid resolution of about 10-12 km. To compare the resolution of these cases with present GMCM’s (Global Mesoscale Circulation Models), it’s better than an N770 or a spectral T1400.
Title |
Supercell thunderstorm and tornadoes in the GFDL global model |
Description |
A stand alone explicit convection ZETAC model simulation was done for the globe with an astonishing averaged grid resolution of about 10-12 km. To compare the resolution of these cases with present GMCM’s (Global Mesoscale Circulation Models), it’s better than an N770 or a spectral T1400. This 24 hour high-resolution experiment (TERRA HRG_a) is visualized below, in addition to lower resolution experiments that have been simulated for up to 80 days total (TERRA HRG_00). Limited region experiments applicable to Pacific Storm Tracking are also presented below. |
Model name |
|
Scientist(s) |
Isidoro Orlanski, Steve Garner, Christopher Kerr |
Date Created |
July 2003 |
Visualization personnel |
Remik Ziemlinski |
Files |
1 Degree AVI (3.2 MB) ½ Degree AVI (1 MB) ¼ Degree AVI (1.3 MB) PNG (742KB) |
TERRA HRG_a
A stand alone explicit convection ZETAC model simulation was done for the globe with an astonishing averaged grid resolution of about 10-12 km. To compare the resolution of these cases with present GMCM’s (Global Mesoscale Circulation Models), it’s better than an N770 or a spectral T1400.
Details
Title |
Supercell thunderstorm and tornadoes in the GFDL global model |
Description |
A stand alone explicit convection ZETAC model simulation was done for the globe with an astonishing averaged grid resolution of about 10-12 km. To compare the resolution of these cases with present GMCM’s (Global Mesoscale Circulation Models), it’s better than an N770 or a spectral T1400. This 24 hour high-resolution experiment (TERRA HRG_a) is visualized below, in addition to lower resolution experiments that have been simulated for up to 80 days total (TERRA HRG_00). Limited region experiments applicable to Pacific Storm Tracking are also presented below. |
Model name |
|
Scientist(s) |
Isidoro Orlanski, Steve Garner, Christopher Kerr |
Date Created |
July 2003 |
Visualization personnel |
Remik Ziemlinski |
Files |
1/425 Degree AVI (2.7MB) 1/8.5 Degree AVI (4.5MB) Png (1.1MB) |