November 19th, 2018
Key Findings
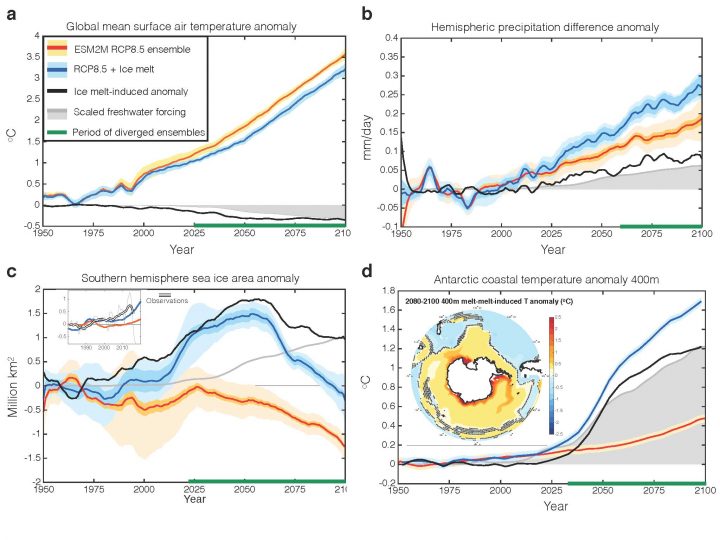
- Adding Antarctic icesheet melt estimates to simulations using GFDL’s Earth System Model significantly alters global climate projections by reducing global warming and therefore transient climate sensitivity, changing precipitation patterns, increasing Antarctic sea ice area, and warming the sub- surface ocean.
- The sub-surface warming will act as a positive feedback mechanism, currently not included in the ice sheet melt estimates, causing up to 35% further ice sheet melt in the future.
- Future sea level rise is likely faster than expected and global warming is likely slower than expected.
- Observations over the satellite era show a positive trend in Southern Ocean sea ice cover. This observed trend can be simulated without ice sheet melt through natural variability, but it is far more likely to occur in a scenario with ice melt.
Benjamin Bronselaer, Michael Winton, Stephen M. Griffies, Ronald J. Stouffer, William J. Hurlin, Keith Rodgers, Joellen L. Russell. Nature. DOI: 10.1038/s41586-018-0712-z
Ice sheet melt is a known neglected forcing in climate model simulations, contributing to uncertainties in climate projections. This is the first study to directly implement estimates of Antarctic ice sheet melt in a climate simulation, showing the actual change in climate projections due to the freshwater input. The authors used a large ensemble to confidently separate the freshwater signal from natural variability and show when we can expect these freshwater-induced effects to become significant.
The study shows that adding Antarctic ice sheet melt estimates to GFDL’s Earth System Model (ESM2M) significantly alters future climate projections. The addition of ice sheet melt to a 21st century climate projection reduces global warming. However, this comes at the more significant cost of potential increased future sea level rise through increased ocean warming. We also show that the ice sheet melt causes more precipitation just north of the equator, and less precipitation south of the equator, due to a Northwards shift in the Inter-tropical convergence zone. This means reduced future drying in areas like Central America, but increased drying in Australia. The authors propose that the freshwater input associated with the ice melt should be included in all future climate simulations to improve 21st century projections.
Observations over the satellite era show a positive trend in Southern Ocean sea ice cover. This observed trend can be simulated without ice sheet melt through natural variability, but it is far more likely to occur in climate model experiments, in a scenario with ice melt. The ice sheet melt also causes sea ice expansion until the middle of the century, suggesting that the observed trend is also likely the beginning of a longer trend.
To determine the climate impact of Antarctic ice sheet melt, the authors took a previously published estimate of 1950-2100 Antarctic Ice sheet melt and applied it directly to 10 members of a 30-member simulation using ESM2M (RCP8.5). The freshwater is put in at the ocean’s surface, in the three closest grid boxes around Antarctic coast. It is has no seasonal cycle.