Skip to content

Multi-variate probability density functions with dynamics for cloud droplet activation in large-scale models

October 1st, 2010


Key Findings

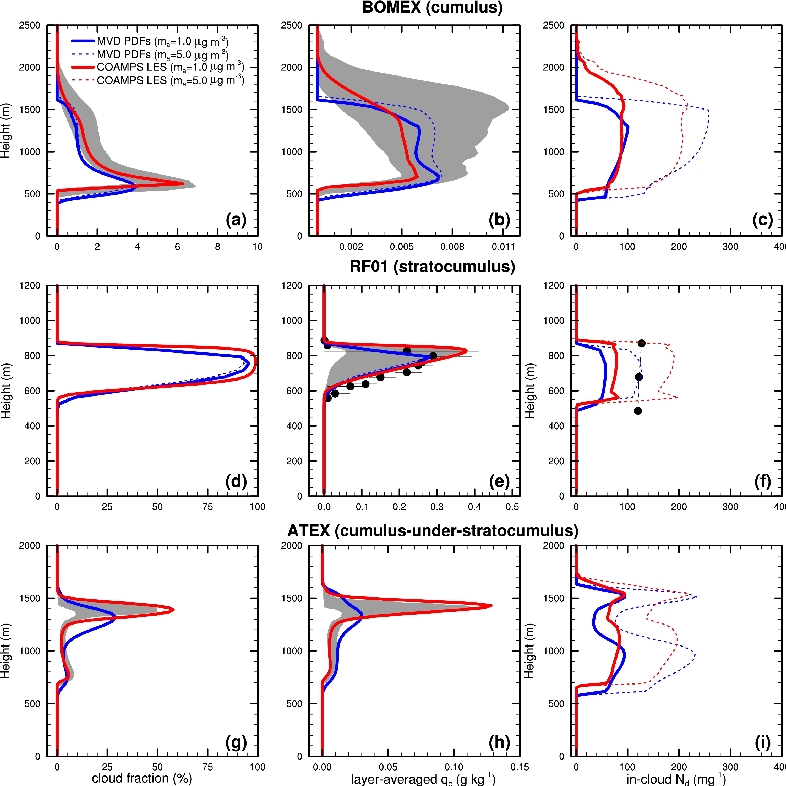
  • Multivariate probability density functions with dynamics (MVD PDFs) are able to simulate full liquid water path (LWP) responses to increasing aerosol concentrations.
  • Dependence of sedimentation on droplet size is essential for full LWP responses.

Multivariate probability density functions with dynamics (MVD PDFs) have been incorporated into the single-column version of GFDL AM3 and extended to treat aerosol activation. MVD PDFs are unique in that they predict the joint distribution of temperature, water mass, and vertical velocity. The distribution of vertical velocity is then a natural link to aerosol activation. This paper presents the first results on the effects of aerosols and precipitation on cloud fraction and cloud liquid using the MVD PDFs and the first results on cloud droplet number concentrations obtained from the distributions of vertical velocity predicted by the MVD PDFs.

Comparison of cloud fraction, layer-averaged cloud water content (q_c), and in-cloud droplet number concentration (N_d) from the MVD PDFs (blue) and from COAMPS large eddy simulations (LES) at different sulfate concentrations m_a for representative cloud cases. The red solid and dotted curves are overlapped in (a), (b), (d), (e), (g), and (h) because the microphysics was not considered in COAMPS LES following a protocol established by GCSS for non-precipitating clouds. Shaded areas indicate the upper and lower bounds of the LES ensemble. Dots in (e) indicate averages of observed q_c, with horizontal bars indicating the first and third quartiles of the observed values. Dots in (f) indicate averages of observed N_d.

Reference:

Guo, H, J-C Golaz, Leo J Donner, D P Schanen, and B M Griffin, 2010, Multi-variate probability density functions with dynamics for cloud droplet activation in large-scale models: Single column tests. Geoscientific Model Development, 3(2), doi:10.5194/gmd-3-475-2010.