March 18th, 2022
Key Findings
- The observed post-El Niño chlorophyll anomaly, “chlorophyll rebound”, in the equatorial Pacific is successfully simulated in GFDL’s Earth System Model, ESM4.1.
- This rebound is primarily driven by surfacing high iron anomalies propagated from the western Pacific via the Equatorial Undercurrent.
- High dust-iron deposition anomalies arising from dry land conditions augment the post-El Niño chlorophyll rebound.
Hyung-Gyu Lim, John P. Dunne, Charles A. Stock, Paul Ginoux, Jasmin G. John, and John Krasting. Geophysical Research Letters. DOI: 10.1029/2021GL096113
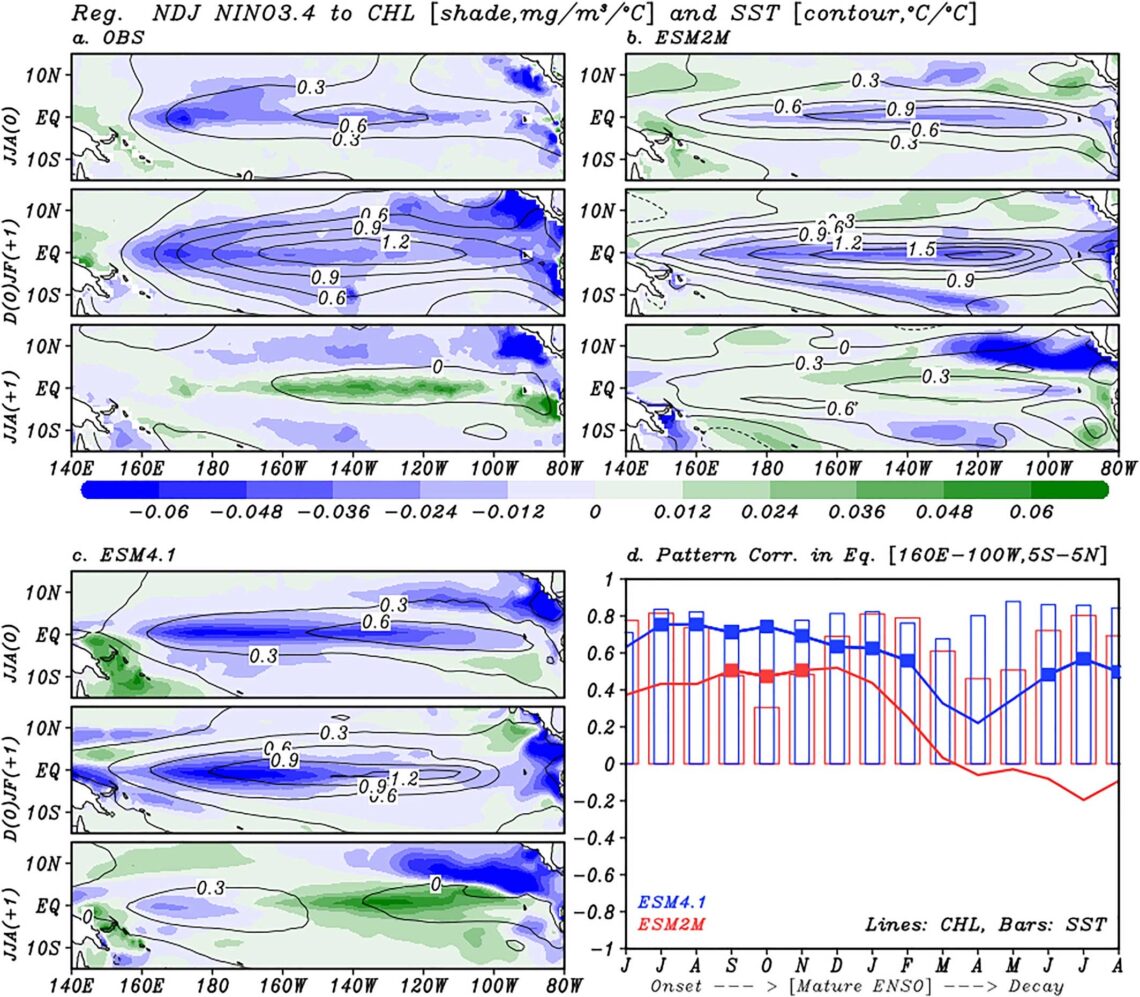
In the tropical Pacific, year-to-year changes in chlorophyll, a proxy for the phytoplankton base of ocean food webs, is dominated by the El Niño–Southern Oscillation. El Niño, triggered by westerly wind anomalies and subsequent redistributions of upper ocean heat content, can sharply reduce the regional supply of nutrients, limiting phytoplankton growth. GFDL’s new Earth System Model (ESM4.1) captures not only the onset and extent of chlorophyll anomalies during El Niño events, but also a pronounced post-El Niño “chlorophyll rebound” that produces positive equatorial Pacific chlorophyll anomalies in the summer following El Niño events.
The authors demonstrate that the post-El Niño chlorophyll rebound occurs as a natural, delayed response to post-El Niño rather than requiring any physical La-Niña response. It is primarily driven by positive iron anomalies propagated from the subsurface western Pacific to the surface eastern Pacific cold tongue via the Equatorial Undercurrent. High post-El Niño dust deposition anomalies arising from dry land conditions in Central and South America augment the post-El Niño chlorophyll rebound.
The chlorophyll rebound provides a key source of resilience to marine ecosystems in the equatorial Pacific, and this research can inform improved ecosystem-based management of living marine resources.