April 19th, 2022
Key Findings
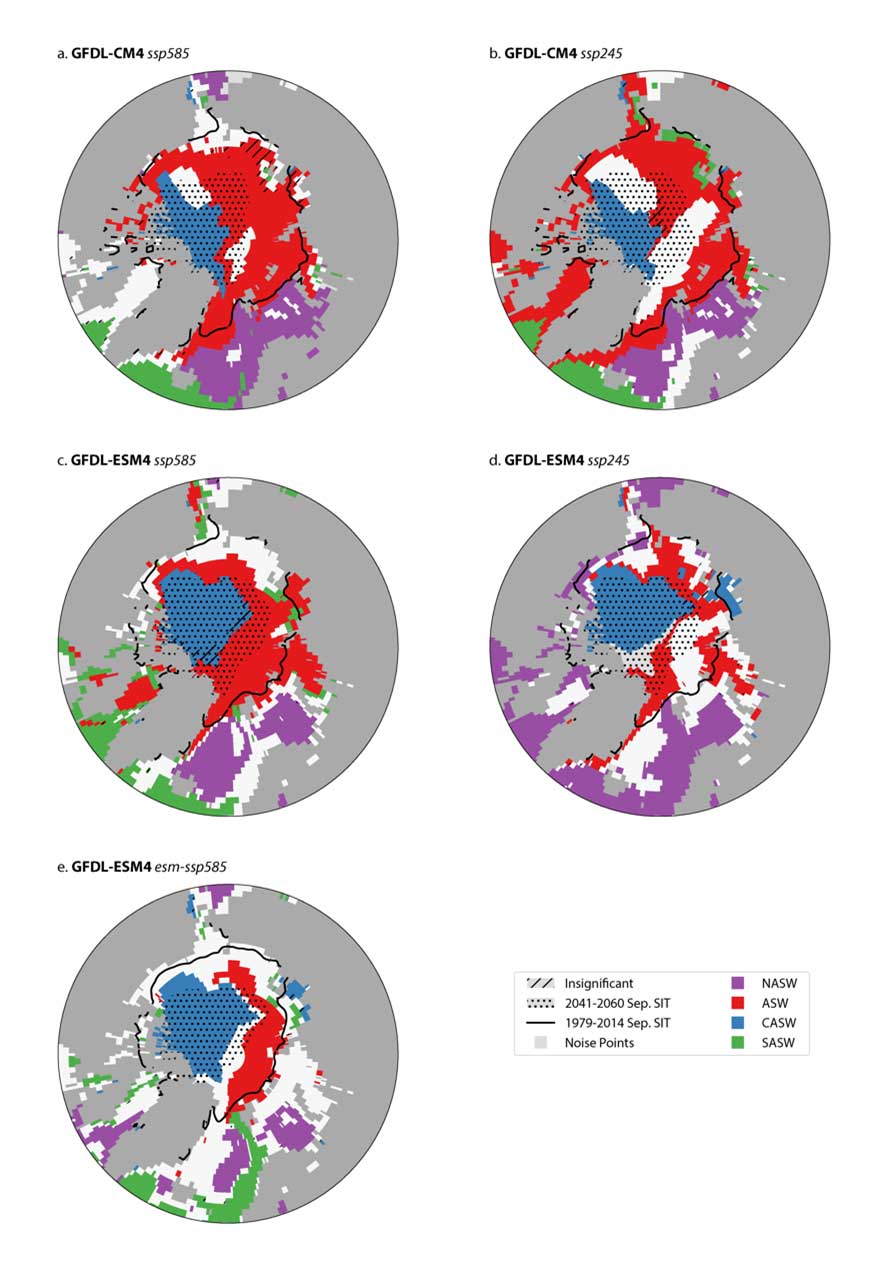
- Unsupervised machine learning methods are used to objectively identify distinct clusters of surface ocean acidification in the Arctic. The clusters are robust across 2 models (GFDL’s CM4 and ESM4) and across a low and high emissions future climate scenario.
- Both models reproduce the observed patterns of global anthropogenic carbon uptake. ESM4 performs the best in overall global integrated uptake, while the higher resolution CM4 model better represents the pattern distributions of anthropogenic carbon in the central Arctic Ocean.
- Changes in the surface freshwater balance of the Arctic Ocean drive reductions in salinity and total alkalinity, which are the main differentiators of the clusters.
- The cluster boundaries align closely with the models’ simulated boundaries of present-day and projected sea ice extent, providing possible observable constraints on the boundaries.
- Stronger trends toward corrosive surface waters in the central Arctic Ocean are driven by early summer warming in regions of annual ice cover and late summer freshening in regions of perennial ice cover.
John P. Krasting, Maurizia De Palma, Maike Sonnewald, John P. Dunne, and Jasmin G. John. Nature Communications Earth and Environment. DOI: 10.1038/s43247-022-00419-4
Ocean acidification (OA) is a consequence of the absorption of anthropogenic carbon emissions and it profoundly impacts marine life. Arctic regions are particularly vulnerable to rapid pH changes due to low ocean buffering capacities and high stratification. This research applied unsupervised machine learning methodology to simulations of surface Arctic acidification using two state-of-the-art coupled climate models. The authors identified four sub-regions whose boundaries are influenced by present-day and projected sea ice patterns. The regional boundaries are consistent between the models and across lower and higher carbon emissions scenarios.
Stronger trends toward corrosive surface waters in the central Arctic Ocean are driven by early summer warming in regions of annual ice cover and late summer freshening in regions of perennial ice cover. Sea surface salinity and total alkalinity reductions dominate the Arctic pH changes, highlighting the importance of objective sub-regional identification and subsequent analysis of surface water mass properties.
Differences in time-average surface temperature, salinity, and pH poleward of 45 ºN for years 2041-2060 compared to 1851-1950 were used as predictors for the unsupervised machine learning clustering routines. The methodology is based on the Systematic AGgregated Eco-province (SAGE) method (Sonnewald et al. 2020) that is targeted at identifying clusters in highly non-linear data. Results are from GFDL’s CM4 and ESM4 models. The experiments analyzed in this study are part of GFDL’s contributions to the Sixth Coupled Model Intercomparison Project and are available through the Earth System Grid Federation.
OA is a central theme in the Intergovernmental Panel on Climate Change Special Report on Oceans and Cryosphere. While climate variability delays the emergence of climate change signals for other properties of the Earth system, the high signal-to-noise ratio of OA is a clear indicator of the effects of anthropogenic carbon emissions on the ocean surface. For more than 95% of the world ocean, the OA signal already emerged from the background natural variability. The Arctic Ocean is particularly vulnerable to acidification as melting sea ice exposes the ocean surface to increasing carbon dioxide in the atmosphere. The freshwater from ice melt also contributes to reductions in sea surface salinity and total alkalinity that accelerate declines in both pH and the carbonate ion saturation states (Ω) that both make the water more corrosive.