November 6th, 2020
Key Findings
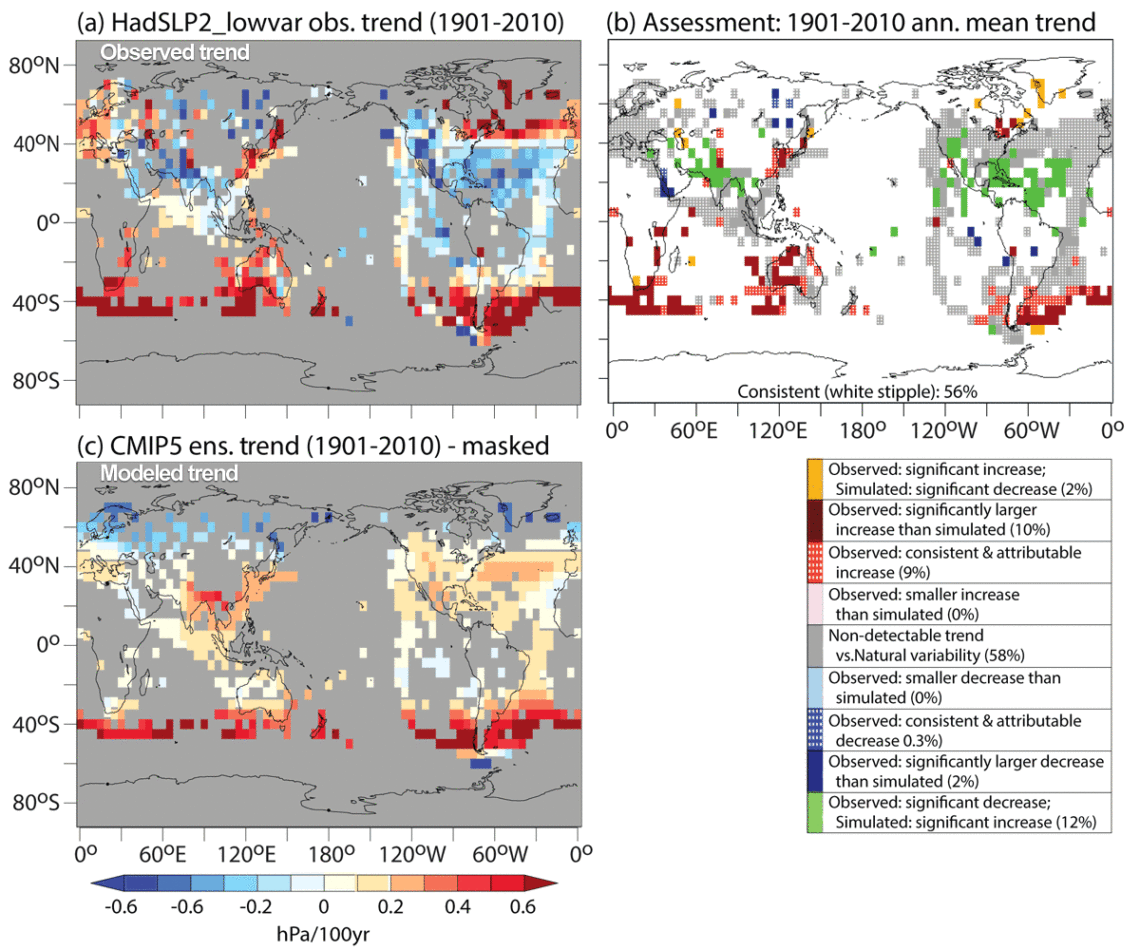
- The most robust evidence for human-induced sea level pressure (SLP) regional change is a zonal band of SLP increase over the southern hemisphere.
- Two observational data products–HadSLP2_lowvar and 20CRv3–disagree on the sign of the century-scale trends in SLP over much of the low-latitude region 25°N-25°S.
- There is little evidence for detection of anthropogenic influence on SLP regional trends in the northern hemisphere extratropics, suggesting limited anthropogenic influence on mean atmospheric surface circulation there.
- Trends over 1981-2010 in all regions appear dominated by internal variability.
Thomas R. Knutson, Jeffrey Ploshay. Journal of Climate. DOI: 10.1175/JCLI-D-19-0997.1
With anthropogenic climate change becoming evident, it is imperative to provide reliable scientific information to society on causes of emerging trends. Sea level pressure (SLP) is a key variable, relevant for impacts and extremes (e.g., steering flows for storms, storm track changes), for which trends and other changes must be monitored and understood. This study explores how the atmospheric circulation may be changing regionally in response to anthropogenic forcing, based on an analysis of sea level pressure trends in observations and models.
The authors examined century-scale historical SLP trends in two different observational data products (HadSLP2_lowvar and 20CRv3) to identify detectable and attributable human influences on those trends and assess the consistency of the modeled historical trends vs. observations at the regional scale. An ensemble of 10 CMIP5 models was used to simulate historical natural variability and responses to anthropogenic forcings, and to test for consistency of models with observations. The observed trends were compared to a series of multi-model ensemble simulations with various forcing scenarios, including experiments with no external forcing (control runs), natural-forcing, or all-forcing (natural plus anthropogenic forcings combined).
Overall, the analysis strongly suggests that some detectable anthropogenic influences are present in regional SLP trends, especially in the southern hemisphere extratropics. The most robust evidence for human-induced SLP regional change is a zonal band of SLP increase over the southern hemisphere (SH), seen clearly in the 1901-2010 and 1951-2010 trends. This is likely associated with an increase in extratropical SH surface westerlies due to increasing greenhouse gases and stratospheric ozone decreases, as reported in previous studies. In contrast, little evidence is found for detectable anthropogenic influence in the northern extratropics, suggesting limited anthropogenic influence on mean atmospheric surface circulation there.
The SLP trends in the lower latitudes are very different for the two observational data products, with the sign of the century-scale trend differing between datasets. This casts some doubt on our ability to identify anthropogenic influences on time-mean circulation in those regions. These large differences in trends between observational products will limit confident detection/attribution/consistency conclusions for lower-latitude regions at least until the observational data product discrepancies are better reconciled.
Trends over 1981-2010 in all regions appear dominated by internal variability, which points to the difficulty in detecting and attributing anthropogenic signals in SLP and circulation for relatively short time scales.