October 13th, 2020
Key Findings
- A 50km high-resolution version of the AM4 atmospheric model captures many aspects of the observed atmospheric river (AR) characteristics well.
- Despite significant regional biases, the model reproduces the observed spatial distribution of AR frequency and variability well, in response to large-scale circulation patterns such as the El Niño – Southern Oscillation, the Northern/Southern hemisphere Annular Mode, and the Pacific North American teleconnection pattern.
- For global warming scenarios, this study shows only a very modest increase of AR length and width, and therefore the occurrence frequency of AR conditions, at a given location — in contrast to most previous studies which show a large increase.
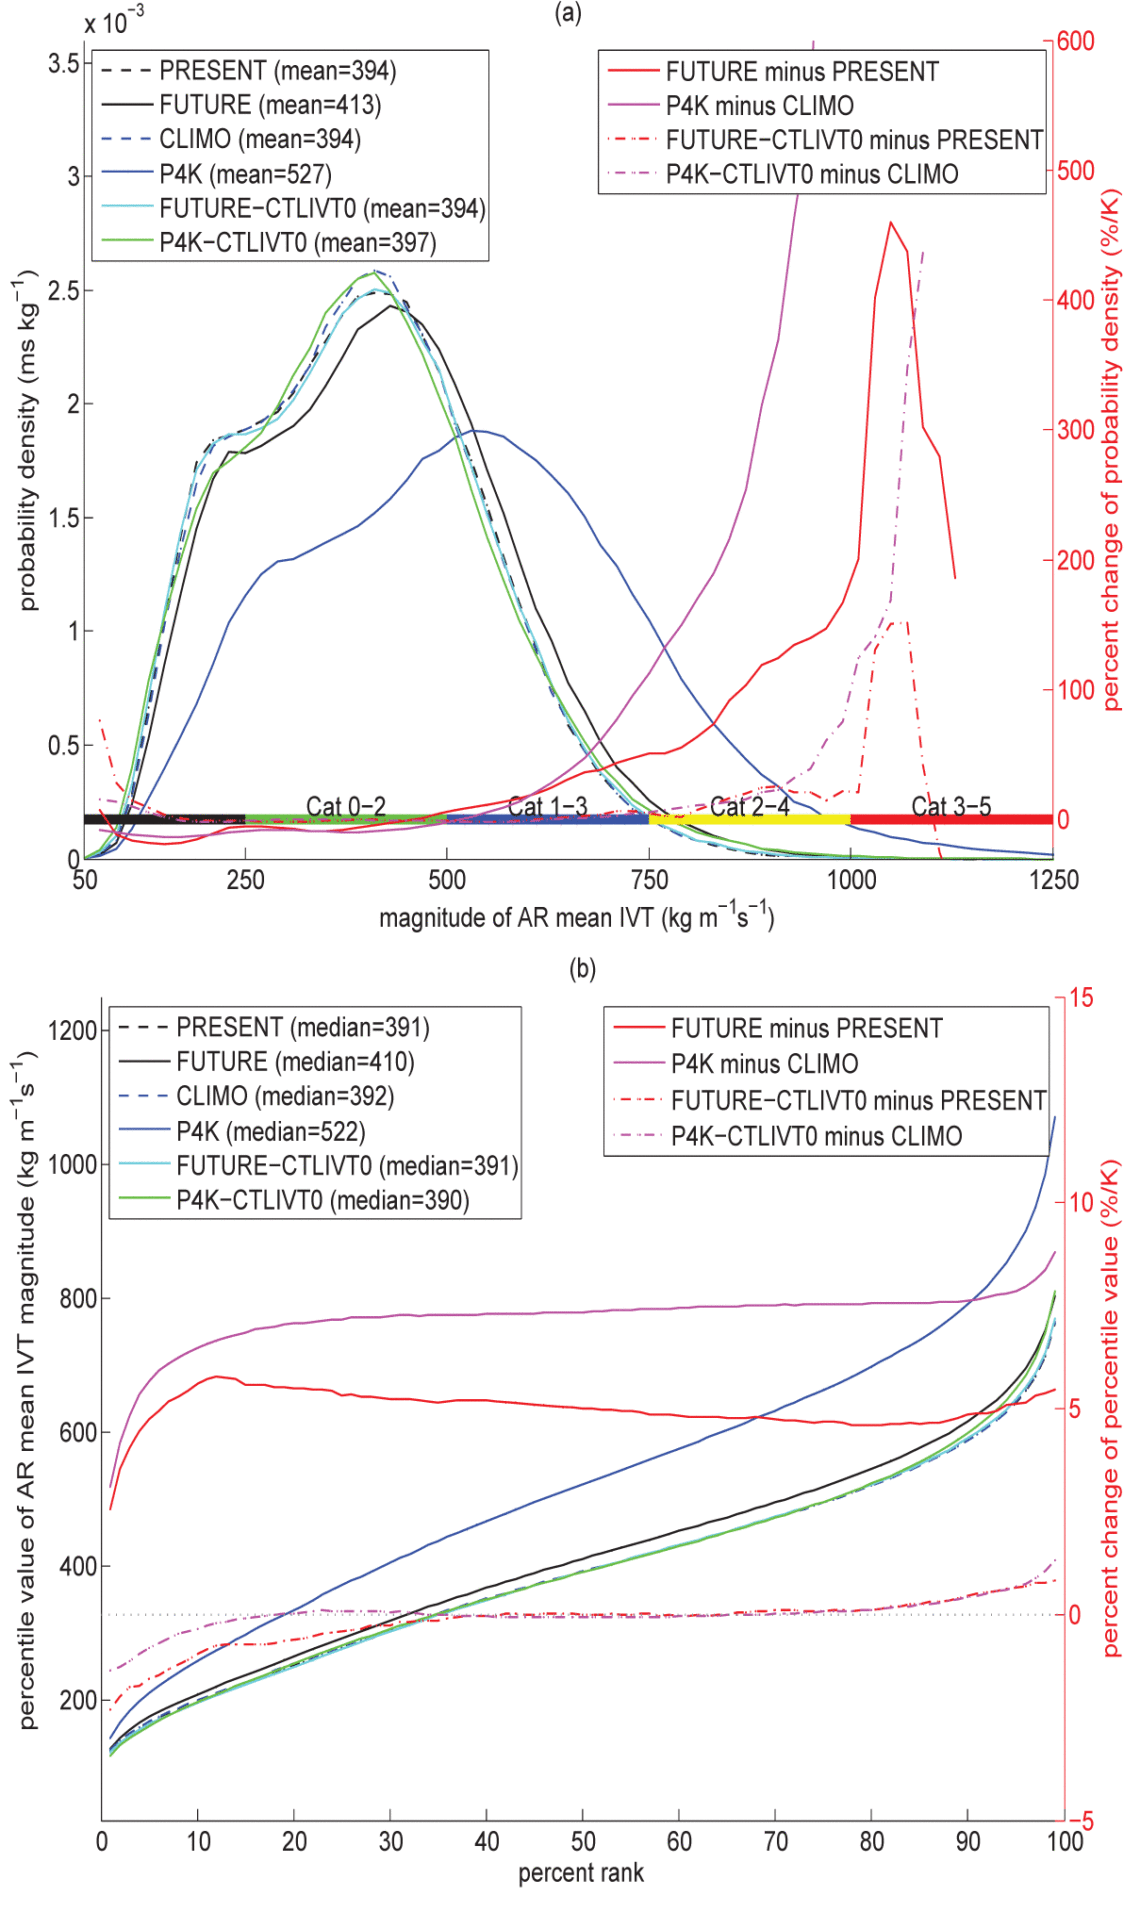
- The model does produce a large increase in strong ARs, with the frequency of Category 3-5 ARs rising by roughly 100-300%/K.
- This study further points out the importance of AR integrated vapor transport thresholds in quantifying modeled AR response to global warming.
Ming Zhao. Journal of Climate. DOI: 10.1175/JCLI-D-20-0241.1
The authors describe a systematic evaluation of GFDL’s new 50km high-resolution version of the AM4 atmospheric model, for its ability to simulate atmospheric river (AR) characteristics including climatology, variability and future change. This study is relevant for assessing the model’s ability to simulate and predict weather and climate extremes such as flood, drought and extreme winds.
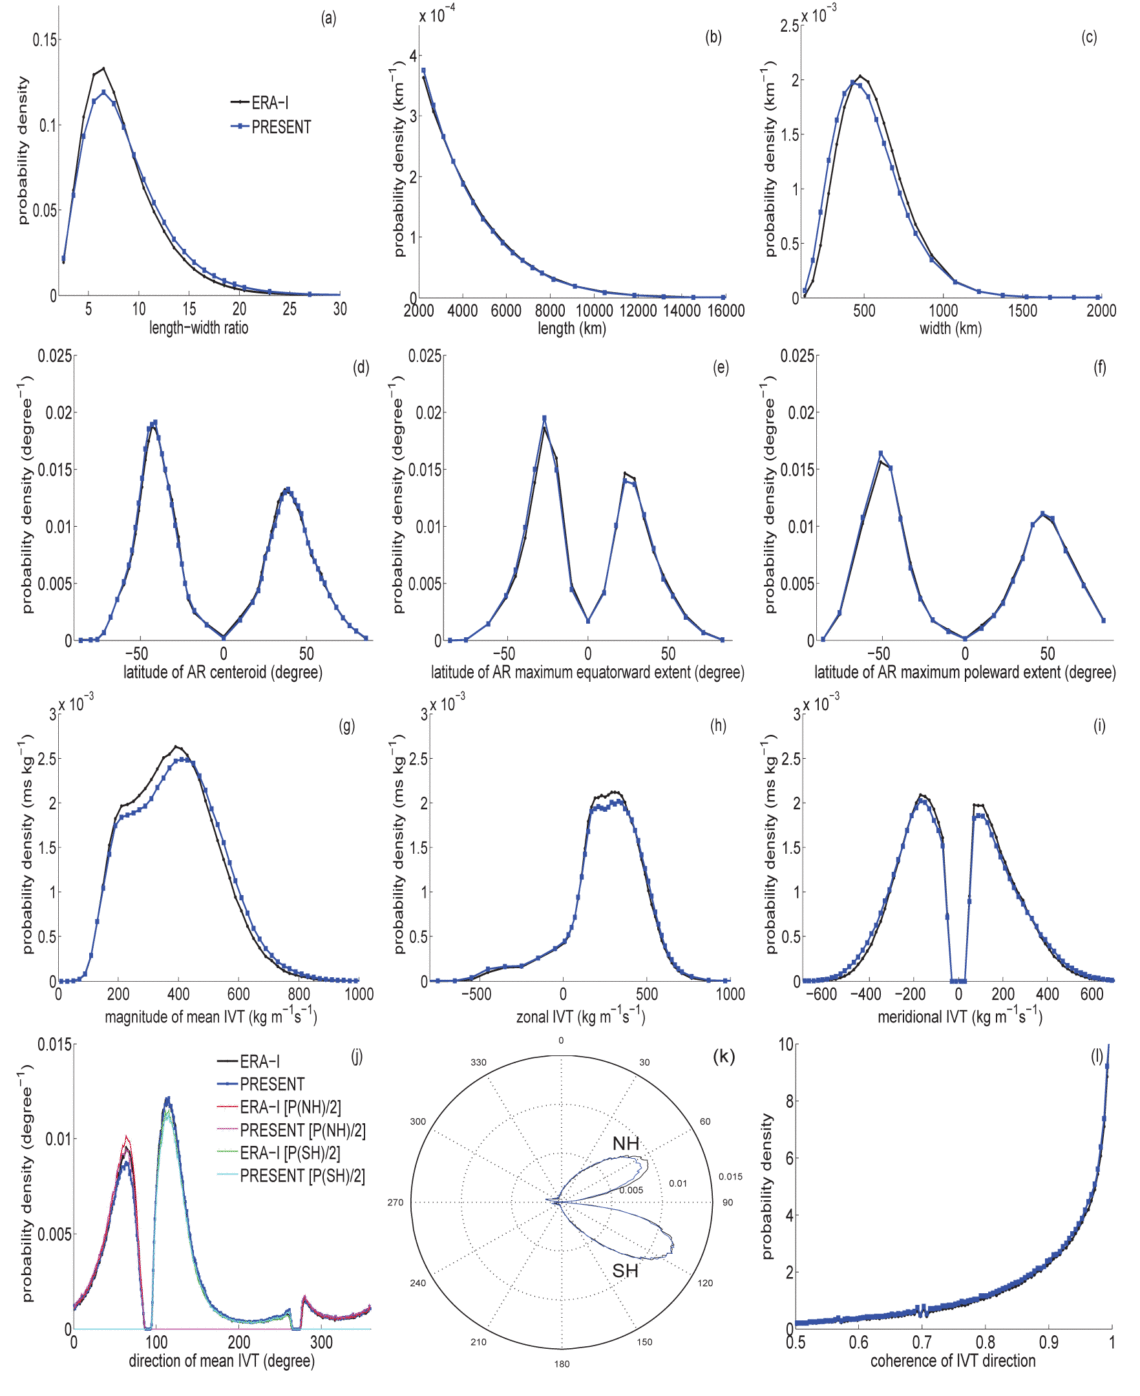
AM4 captures many aspects of the observed AR characteristics including the probability density functions of AR length, width, length-width ratio, geographical location, the magnitude and direction of AR mean vertically integrated vapor transport (IVT) with the model typically producing stronger and narrower ARs than the European Re-Analysis Interim product. Despite significant regional biases, the model well reproduces the observed spatial distribution of AR frequency and variability in response to large-scale circulation patterns such as the El Niño – Southern Oscillation, the Northern/Southern hemisphere Annular Mode, and the Pacific North American teleconnection pattern.
For global warming scenarios, in contrast to most previous studies which show a large increase in AR length and width and therefore the occurrence frequency of AR conditions at a given location, this study shows only a very modest increase in these quantities. However, the model produces a large increase in strong ARs with the frequency of Category 3-5 ARs rising by roughly 100-300%/K. The global mean AR intensity as well as AR intensity percentiles at most percent ranks increase by 5-8%/K, roughly consistent with the Clausius-Clapeyron scaling of water vapor. This study further points out the importance of AR IVT thresholds in quantifying modeled AR response to global warming.