Skip to content

Seasonal- and annual-mean precipitation extremes occurring during 2013: A U.S. focused analysis

September 29th, 2014


Key Findings

  • Extreme annual and seasonal mean precipitation occurred over several U.S. regions in 2013.
  • For two regions, in the north-central and eastern U.S., these extremes were at least partly attributable to a combination of anthropogenic and natural forcing according to the CMIP5 models.
  • Nonetheless the magnitudes of the precipitation extremes in these regions were primarily attributable to internal climate variability.

Thomas R. Knutson, Fanrong Zeng, and Andrew T. Wittenberg. Bulletin of the American Meteorological Society.

Summary

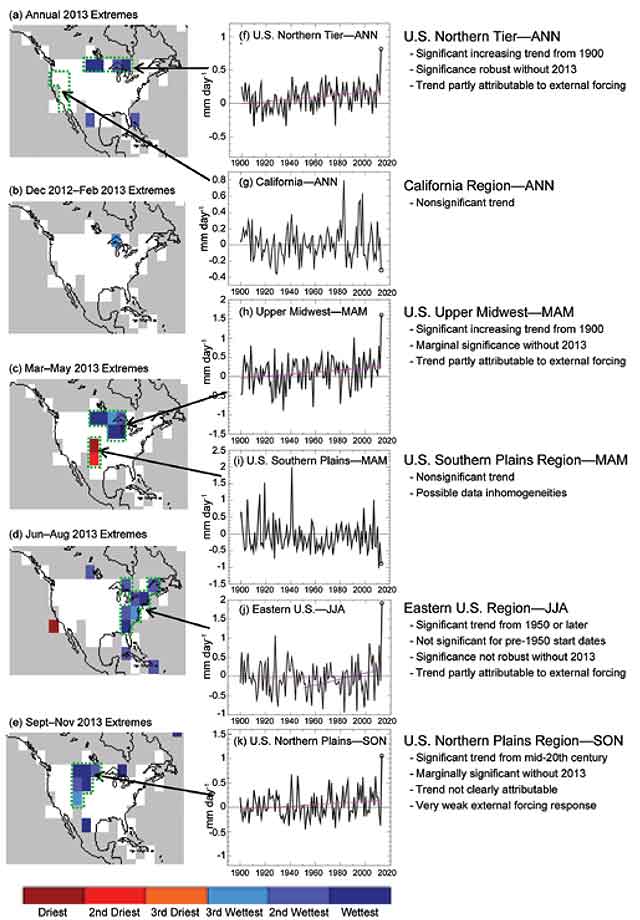
Extreme seasonal/annual precipitation, defined here as ranking first, second, or third highest or lowest in the record of at least 100 years, occurred in several continental U.S. regions during 2013. The authors of this study used CMIP5 models to simulate internal climate variability and the response to historical anthropogenic and natural forcings, for the Northern Tier and the Upper Midwest regions of the U.S. This study suggests that, for these two regions, extreme annual or seasonal positive precipitation anomalies over the U.S. were at least partly attributable to a combination of anthropogenic and natural forcing.

In these two regions, significant increases were detected since 1900, according to linear trend tests and by comparison to CMIP5 control run variability. The long-term trends in these two regions/season were also consistent with the CMIP5 All-Forcing ensemble and thus partly attributable to external forcing (anthropogenic plus natural).

Since the estimated 2013 forced anomalies in these regions from the CMIP5 All-Forcing runs (compared to 1900-1940 baseline) were much smaller than the observed anomalies, an important role for internal variability is suggested by the models. Nonetheless, simulated anomalies exceeding the 2013 observed anomalies were more likely in the CMIP5 All-Forcing run distributions than in the control (unforced) run distributions, with an attributable risk fraction (to anthropogenic and natural forcing) of about 0.5 to 0.7.

Substantial uncertainty remains in quantifying internal climate variability. Uncertainties in historical forcings and regional climate sensitivity increase the overall uncertainty, but are addressed to some extent through a multi-model ensemble approach. The analysis needs to be extended to other regions to place the results in a broader spatial context.

Fig. 6.1. Left column (a–e): Colors identify grid boxes where the annual or seasonal precipitation anomalies for 2013 rank first (dark red), second (red), or third (orange) driest or first (dark blue), second (medium blue) or third (light blue) wettest in the available observed record (see map legend). The seasons are DJF (December 2012–February 2013); MAM (March–May 2013); JJA (June–August 2013); and SON (September–November 2013). The various averaging regions used in the study are shown by the green dashed outlines in (a–e). Gray areas did not have sufficiently long records, defined here as containing at least 100 available annual or seasonal means, with an annual mean requiring at least three of four seasons to be available, and a seasonal mean requiring at least one of three months to be available. Center column (f–k): Time series of precipitation from the extremes regions shown by arrows/green outlines (see also Fig. S6.1 for region definitions). Black: observed anomalies in mm day–1; purple sloping line: significant linear trends (1900–2013, except 1950–2013 for eastern U.S. region—see text for explanation). The observed anomalies for 2013 are circled for emphasis in (f–k). The overall analysis results of the paper are summarized for each region in the right column.