

Posted on May 11th, 2011 in Isaac Held's Blog
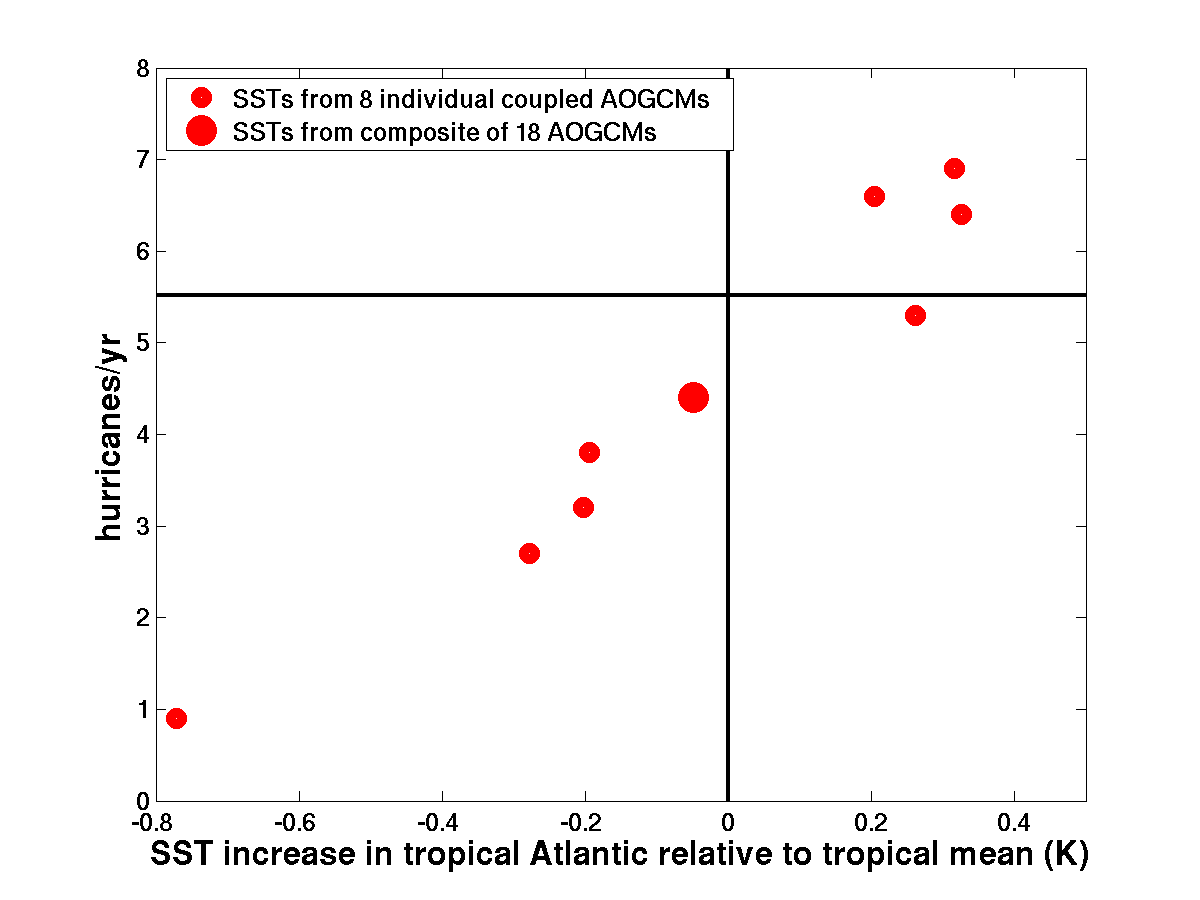
The number of Atlantic hurricanes simulated by the model of Zhao et al 2009, when boundary conditions are altered to correspond to the changes in sea surface temperature (SST) simulated in 8 of the CMIP3/AR4 models for the A1B scenario by the end of the 21st century (small red dots), and to the ensemble mean of the changes in SST in 18 CMIP3/AR4 models (big red dot). The horizontal line indicates the number of hurricanes/yr in the control simulation.
These results, and the discussion that follows, are based on collaborative work with Ming Zhao, Gabriel Vecchi, Tom Knutson and other GFDL colleagues. (Some of the model runs utilized here were discussed in Zhao et al 2009 and Vecchi et al 2011, — the full set will be discussed in a forthcoming paper.)
Given the global atmospheric/land model described in post #2, which appears to simulate certain aspects of the statistics of tropical cyclones in the Atlantic quite well, what does the model predict for the change in these statistics in the future? And how seriously should we take the result?
Calculations in which the evolution of the ocean and sea ice are computed by one model, from which boundary conditions are extracted for a (higher resolution) atmosphere/land model, are often referred to as “time-slices”. This is the setup that we are using here. It has important limitations, which I will eventually get around to discussing.
We have taken the SST anomalies generated by 8 different coupled atmosphere-ocean models in the CMIP3 archive, looking at the trend over the 21st century in the “A1B” scenario, in which CO2 doubles over the century, ending up at about 720ppm. We use a 20 year control simulation of the atmospheric model in which the prescribed SSTs repeat every year and then perturb these SSTs by the spatially and seasonally varying warming trend from these 8 models in turn. (We also double the CO2, but the response of the model to this change in CO2 with fixed SSTs, although interesting, is comparatively modest and, in any case, the same in each experiment. CO2 and the other forcing agents active in this scenario can be thought of as exerting their effect on Atlantic storms in this model primarily through the SST perturbation.) The results for Atlantic hurricanes are presented on the vertical axis in the figure at the top. From a control value in the model of about 5.5/yr the warmed climates produce numbers ranging from close to zero to a ~30% increase over the century. Also shown as a big red dot is the result from running the model over the ensemble mean of the ocean warming patterns from 18 different AR4 models.
At first sight this spread is a bit discouraging. It is noteworthy that none of these simulations produces a dramatic (factor of 2 say) increase in frequency. But more interesting is the correlation with the quantity plotted on the horizontal axis: the differential warming of the Atlantic with respect to the warming of the tropical mean ocean surface — more precisely, the increase in SSTs averaged over Aug-Sept-Oct and over the Atlantic Main Development Region (MDR) (defined here as [80W-20W, 10N-25N]) minus the average in the same time period for the tropical mean SSTs (30S-30N). The modeled SSTs that produce more storms in our time-slice simulation warm the Atlantic MDR more than the tropical mean, and vice-versa. Close inspection of the plot also suggests a modest reduction in hurricane frequency even when the warming is uniform (a result we have confirmed by increasing SSTs uniformly — and simultaneously increasing the CO2).
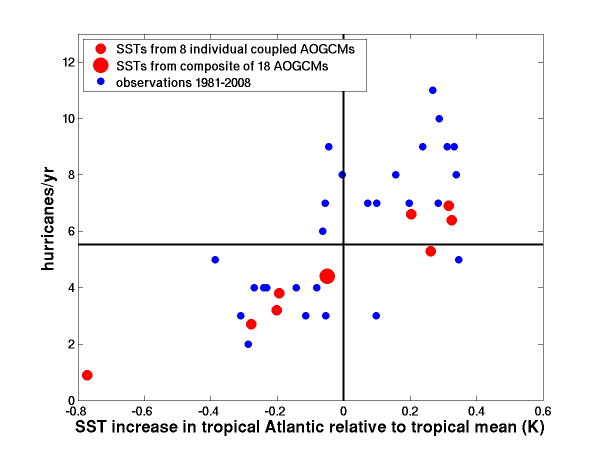
It is informative to plot all of our simulations that use observed SSTs (from HadISST) from each year (discussed in post #2) on the same figure (top: blue dots are 4 individual realizations for each year; green dots ensemble means for each year.) One can make the same plot for observations (bottom, using IBTrACS and HadISST). Ideally, the observations would look like a sample of the blue dots on the top.
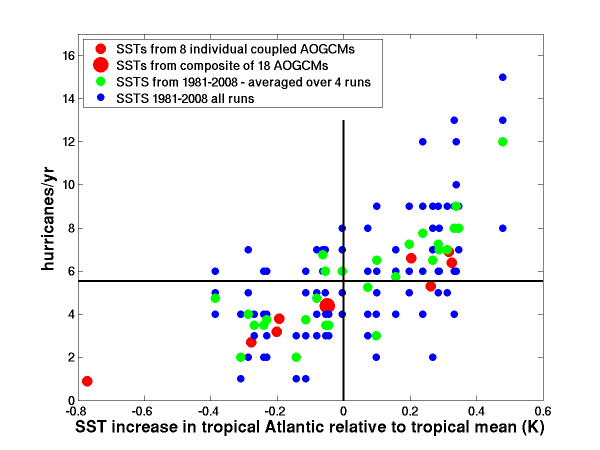
 So the simulated and observed variations over the 1981-2008 period show about the same relationship between hurricane counts and differential warming of the Atlantic MDR as do the climate change simulations. What is the underlying dynamics?
My picture of the tropics is that of a circus tent (the temperature in the tropical upper troposphere) held up by poles (deep tropical convection) of different heights (the SST determining how high the pole is). The tent is made of a stiff material (horizontal temperature gradients are hard to maintain in the tropics above the boundary layer), so if your pole is too short and/or too close to a bigger pole, it will not stand (the convection will fizzle). If Atlantic SSTs are not high enough, deep convection is muted, losing the competition to the Pacific. (A complication is that the shape of the tent held up by a single pole is not symmetric, but similar instead to the classic Matsuno-Gill model of the response to localized tropical heating (see the middle panel on p. 454.)
One implication is that if the Atlantic SSTs are not high enough, there won’t be enough deep convection to organize into tropical storms. But probably more important is that the vertical shears of the horizontal wind will be bigger, a classic factor suppressing storm development. Very roughly, vertical shears are larger the farther away one is from the bulk of the tropical convection. (In the vicinity of the convection there is low shear typically but a lot of net upward motion and therefore upper level divergence of air and lower level convergence. As one moves away from the center of this convergence/divergence pattern, differences in the flow in the upper and lower troposphere get larger — even more so because the Coriolis force turns the upper and lower level flows to create additional shear in the wind component perpendicular to the inflow/outflow.)
The differential warming index defined here is not necessarily the best one could come up with (and admittedly works much better in the Atlantic than in other basins.) Among other things, it does not take into account the shape of the tent, or of the spatial structure of the winds related to this shape. Even more simply, rather than the tropical mean as reference, one would probably be better off with a (climatological precipitation)-weighted mean, as in Sobel et al, 2002 — it doesn’t matter what the SST is in regions where the poles are always too short to contribute to holding up the tent..
If we accept this differential warming hypothesis, it implies that the upward trend in hurricane frequency over the past few decades in the Atlantic exists because the tropical Atlantic has warmed faster than the tropics as a whole over that period. If you compute linear fits to the time evolution of hurricane count and of this differential warming index from 1981-2008 the result is that one moves along this black line:
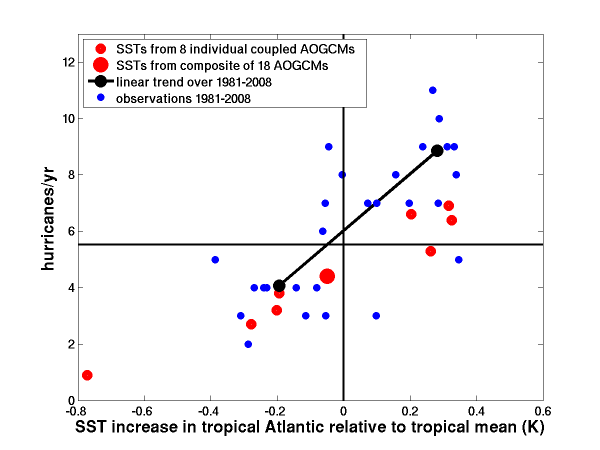 If we scale down the differential warming produced by the different GCMs over the 21st century by the ratio of the projected global or tropical mean warming over the century to that observed over this 30 year period, we see that none of the model results approach the magnitude of the observed trend. These projections are dominated by the increase in the well-mixed greenhouse gases. The implication is that either 1) models are grossly underestimating the potential for large differential warming of the tropical oceans forced by increasing well-mixed greenhouse gases, or 2) the observed differential warming, and the corresponding increase in Atlantic hurricanes, is primarily due to something else, either multi-decadal variability in the Atlantic, or a reduction in aerosol forcing over this period, or some combination. If 2) is the case, as these results suggest, we should not assume that this trend will continue into the future.
These differential SST changes are small and powerful (the slope we are talking about is roughly 1 hurricane/0.1K, or a doubling for a 0.5K differential warming) Can we trust the SST observations at the level needed to test this hypothesis adequately?
If one accepts this differential warming hypothesis, we are punting back to the coupled atmosphere-ocean models. We need more confidence in the spatial pattern of warming in the tropics, not just the overall level of tropical warming, to infer changes in hurricane frequency in the Atlantic. Better downscaling strategies may not, in themselves, reduce uncertainties much.
Let me emphasize that I am addressing here the narrow question of the frequency of all Atlantic hurricanes, not changes in the hurricane intensity distribution. Several lines of argument, not discussed here, suggest that changes in the intensity distribution could result in changes in the frequency of extreme (category 4-5) hurricanes that are very different from changes in the total number of hurricanes. Also not addressed are possible shifts in the locations of hurricane activity within the Atlantic basin that might change the fraction of hurricanes that make landfall.
[The views expressed on this blog are in no sense official positions of the Geophysical Fluid Dynamics Laboratory, the National Oceanic and Atmospheric Administration, or the Department of Commerce.]
A few comments on this: First, there is, to the best of my knowledge, no theory of tropical cyclones in which SST (relative or absolute) plays any role. With the minor exception of radiative transfer from the sea (which one expects plays little direct role in hurricane formation or intensification), the atmosphere only knows about turbulent heat and moisture fluxes from the sea, which depend on wind speed and air-sea disequilibrium. So a better quantity would be , where
  is the saturation moist static energy at the sea surface, and
  is the actual moist static energy of the boundary layer. If the atmosphere in which hurricanes develop is nearly neutral to convection, then
  , where
  is the saturation moist static energy of the troposphere, which is approximately constant with height if the atmosphere has a moist adiabatic lapse rate. One might guess that
  is related to something like tropical mean SST, but unlike relative SST, this metric will change with a uniform change in SST.
A second issue is that on time scales longer than the thermal equilibration time scale of the ocean mixed layer, the quantity is controlled strictly by local processes: net radiative flux into the ocean, near-surface wind speed, and convergence of ocean heat flux into the ocean mixed layer. Instantaneously warming the eastern tropical Pacific will quickly reduce
  over the Atlantic, but wait 2-3 years and
  will be back to normal as the SST adjusts to the new atmospheric temperature. (But note that ENSO is too fast for this equilibration to occur.)
In reference to your last graph, you pose 2 possible explanations for the discrepancy between models and observations with respect to the recent increase in hurricane frequency in the Atlantic. But I have argued that there is a third: The fall of near-tropopause temperatures in the real world, not well captured by most AOGCMs. We believe that this has played an important role in Atlantic TC activity in recent decades, as we argued in a preprint from the most recent AMS hurricane conference.
Kerry, the atmospheric model has as input the SST field (let’s agree to ignore the relatively minor effect of varying CO2 with fixed SSTs). So by construction I don’t have to refer to anything else when I ask what the model is responding to. It may very well be that a theory for how this particular model responds to SST anomalies naturally consists of two parts: how something (let’s call it A) responds to SSTs; and how hurricane frequency responds to A. I would agree that a good candidate for A is the surface flux of energy. I am not sure whether you are arguing that the agreement between this atmospheric model and the observed climatological genesis distribution, and its seasonal cycle and interannual variaiblility (all shown in post #2), is fortuitous, or if you are arguing about our particular way of describing the results (by leaving the causal connection through A implicit.)
Given an atmospheric model, I could run it with prescribed surface temperatures or prescribed surface energy flux over ocean (in practice, the easiest way to generate the latter model is to couple to a shallow ocean mixed layer and impose heat flux into or out of the bottom of this shallow ocean layer). Suppose I take our prescribed SST simulations from the 1981-2008 period, shown in post #2, and compute the surface fluxes. Then run the model (coupled to the shallow ocean layer) driven by these surface fluxes, letting the SSTs adjust as needed. Would the results be fundamentally different? There would be differences (Sarah Kang and I have been doing calculations of this sort in a more idealized setting, and there are a number of other relevant modeling studies in the literature) but the I doubt that the result would fundamentally change in the Atlantic. I think I would agree that it is generally more natural to force with a heat flux rather than prescribed SST anomalies, but we don’t have the data to do this and test the model against interannual variability. From this perspective, we are simply assuming that the model-generated surface fluxes are good enough for this purpose.
With regard to the trend, I think there is more room for fortuitous agreement. If one could make the case that the model’s trend in surface energy flux were different than observed, I would take this as evidence against the model (agreeing that it is better to have a model with the right energy fluxes than the right SSTs). Assuming that the AMO is a big part of the story (ie internal variability in the transport of energy in the ocean from the southern to the northern hemisphere) this will change the surface fluxes that the atmosphere adjusts to (in addition to changing the SSTs). So I have no difficulty in seeing how, from an energy flux perspective, internal multi-decadal AMO-like variability can create a trend in hurricane frequency for several decades.
Whether near tropopause cooling can modify genesis, or only intensity, is unclear to me. But the question of the reliability of these temperature trends takes precedence over any other considerations.
The final plot does not show disagreement between the model-generated and observed trends over recent decades. As discussed in Zhao et al 2009, and as can be seen in post #2, the agreement is actually pretty good.
A naive question. Assume that the relation between SST and hurricane number is correct and extend the data back to 1800 or as far back as you can. Does the number of observed hurricanes fall below the fit line, in accord with ideas about hurricanes often being missed in earlier years.
Here is an attempt at correcting for missed hurricanes that I am familiar with, leaving little or no trend, but this is not without controversy. If all you are trying to do is distinguish between theories tied to local Atlantic temperatures, which have warmed, or theories based on something like the relative warming of the Atlantic and the rest of the tropical oceans, which presumably have changed a lot less, then the latter would clearly be favored by this adjusted data set. But to test this idea more quantitatively over these longer time scales, you would need a lot of confidence in the SST and in the hurricane data. Qualitatively, at least, the mid-century hurricane peak is plausibly explained by relative Atlantic SSTs.