

Posted on February 22nd, 2011 in Isaac Held's Blog
The eastward component of the wind in the lower troposphere (850 hPa) simulated by an atmospheric model with roughly 50km horizontal grid.
(1 frame/6 hours for one full year, starting in January)
To help introduce myself, I’m starting with a post on a topic that I’ve been working on recently: the simulation of tropical cyclones in global atmospheric models.
Climate models are gradually moving to finer spatial resolution. Our lab is actively developing global atmospheric climate models with roughly 50 and 25 km grid spacing (even finer models are being run very experimentally), and there are a number of related efforts around the world. (In comparison, horizontal resolutions in most of the global atmospheric models referenced in the IPCC’s 4th assessment are of the order of 100-300km). The animation above is from a 50km model, and shows the lower tropospheric winds over a year of simulation. More precisely, it shows the east-west component of the wind vector (white => westerly –that is, from the west; black=> easterly) in the lower troposphere, on a constant pressure surface as is customary in meteorology. The actual surface protrudes above this level in places, especially the Tibetan plateau, and in those areas we use the near-surface wind instead, to avoid having to mark the data as missing in the animation. I like plotting the east-west (zonal) component like this, with a gray scale — it gives one the feeling of looking at a 3d contour map of sea-level pressure, lighted from the south in the Southern Hemisphere and from the north in the Northern Hemisphere (because the east-west component of the winds is closely related to the north-south gradient of the pressure).
I want to focus here, not on the dominant mid-latitude waves that are associated with the highs and lows and jet stream meanders familiar from weather maps, but the small isolated vortices that form in the tropics. These seem to develop in a variety of ways and have sizes that are not well-resolved by the grid. Do they correspond with anything in the real world?
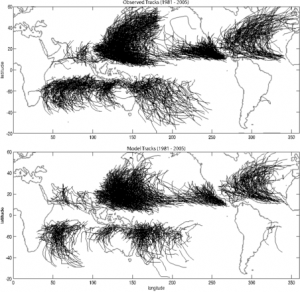
Ming Zhao, S.-J. Lin, Gabe Vecchi and I discuss this model in this paper, where we describe 4 runs of the model specifying the observed sea surface temperatures (SSTs) over the period 1981-2005, differing only in their initial conditions. The animation is the simulation of 2005, the very active North Atlantic hurricane year, from one of these realizations. What makes this a simulation of 2005, rather than some other year, is the prescribed SSTs. Here are three figures from the paper, all related to strong vortices with winds in excess of 33 m/s near the surface, a standard definition of a hurricane in the Atlantic In each case the observations are from IBTrACS.
Picking one of these realizations, this figure shows the paths of all tropical storms that reach hurricane strength at some point in their lifetime over this 25-year period. Observations on the top.
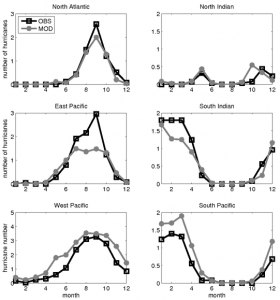
The next figure shows the seasonal cycle in the number of these hurricane-like vortices forming in different ocean basins, averaging over all 4 realizations (1= Jan; 12 = Dec).
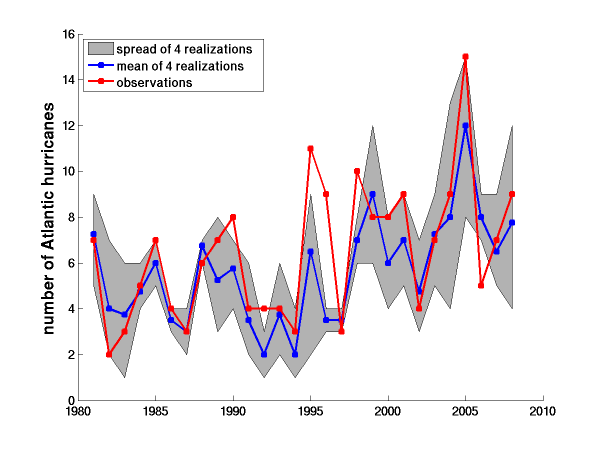
Finally, here is the year-by-year comparison of the number of hurricane-like vortices forming in the North Atlantic. The gray area spans the 4 realizations; blue is the mean of these; red is the observations. (The comparable figure in the paper extends from 1981-2005, but we have since extended these runs through 2008. Also, in the paper we normalize the results so that the mean number of hurricanes is the same in the model and observations, but this doesn’t make much different in the Atlantic, so I have omitted this normalization here.)
 In light of these comparisons, I feel comfortable referring to the strong tropical vortices in this and similar models as the model-simulated “hurricanes” rather than “hurricane-like vortices”.
Further analysis reveals a number of limitations. The model produces hardly any storms in the Atlantic beyond category 2. In effect, the model hurricanes resemble each other a lot more than do observed storms, and are mostly minimal hurricanes. In addition, the model storms have larger horizontal scales than observed hurricanes.
Here is a list of questions that we and others doing similar work are thinking about, some of which we have begun to address in other papers. The first question is more fundamental than the others, since it addresses the appropriateness of this model framework; the other questions concern the model results, given this framework.
The model is run over prescribed ocean temperatures as a lower boundary condition. How much is this decoupling of atmospheric and ocean dynamics distorting these results? If we coupled a model like this to an ocean model and let it run freely, we could still use its climatology and seasonal cycle as tests (the first and second figures above), but we wouldn’t have an analogue of the final figure, since a free-running coupled model would produce its own year-to-year variability in SSTs that, even if the model were perfect, would resemble the observed variability only in its statistics. We wouldn’t be able to directly ask if the model captures the very active 2005 season, but only how often it produces 2005-like seasons. (The same issue arises, in the context of climate sensitivity, when comparing the simulated and observed interannual variability of the radiative energy fluxes at the top of the atmosphere.)
What aspects of the SST field control Atlantic hurricane numbers in this model? A related question is — if one is attempting seasonal forecasting of the Atlantic hurricane season, predicting statistics for the next season before it begins, what aspects of the evolution of the SST field is it most important to get right ?
What are the mechanisms within the model by which SSTs influence the interannual variability of tropical cyclone numbers, and are we confident that these are the same mechanisms operative in the atmosphere? Are these mechanisms the same as those underlying the trend in Atlantic storms over the time period shown?
The problem of the simulation of tropical cyclone numbers seems to be more or less decoupled from the simulation of internal storm structure, such as intensity and size, since one seems to do well on the former with models that are inadequate for the latter. Does this make sense?
The spread in storm numbers among the 4 realizations, the gray area in the figure, gives us an estimate of the noise in the fixed SST system — the part of the interannual variability associated with atmospheric chaos that exists even if SSTs are held fixed. Is the model’s estimate of this fixed-SST noise reliable, assuming that we had a larger number of realizations to estimate the noise a bit more quantitatively?
When we warm the oceans in this model uniformly, the number of tropical cyclones in the North Atlantic, and averaged over the tropics, decreases. Why?
What parameters in the model affect these results most strongly?
The last question provides an entree into the issue of model “tuning” or “optimization”, which I will return to in future posts. It should be clear from the animation that this is not the kind of model that consists of rules like {if conditions X,Y and Z are satisfied, then form a tropical cyclone}. Rather, these cyclones emerge from the underlying fluid dynamics and thermodynamics. If empirical rules are well-supported by observations one would hope that the model would obey them as well. But they are not built in. The parameters at our disposal invariably relate to assumptions concerning the sub-grid scale fluxes of energy, momentum and water.
I am a newcomer to tropical cyclone research, and still on a learning curve. I can see how models with a 50km grid could be distorting some of the mechanisms controlling storm genesis. But results like those discussed above convince me that models of this flavor hold great promise for studies of tropical cyclone formation, including the effects of global warming on storm numbers. There is a lot of ongoing work applying this kind of model to the problem of tropical cyclone frequency in a warming world (this paper has a lot of the references). What kinds of observational tests, besides those illustrated above, would be useful in assessing the credibility of a model for this purpose, or the credibility of an ensemble of models in spanning the range of uncertainty?
[The views expressed on this blog are in no sense official positions of the Geophysical Fluid Dynamics Laboratory, the National Oceanic and Atmospheric Administration, or the Department of Commerce.]
Impressive simulation. one possibility to make it more life-like might be that the tropical cyclones are directed and stabilized by the locations and stabilities of the far away (polar) fronts and subtropical highs. can’t say how to introduce it in the model. Is there some sort of very small random element included in there or is this completely deterministic model?
The model is completely deterministic except for a relatively minor stochastic element in the cloud/radiative interaction included primarily for computational efficiency. The polar fronts and subtropical highs emerge from the underlying “microscopic” rules of the model just as do the tropical vortices.
In fact, very impressive, I don’t know of any models that would produce the seasonal cycle that well, good luck in finding co-workers. I guess you’re rapidly becoming the top authority on this.
Isaac: The success of these simulations in simulating the major features of tropical cyclone climatology and variability dovetails nicely with the success of downscaling techniques such as that developed by Tom Knutson, and with the efficacy of genesis indices based on the large-scale, monthly mean state. The surprising thing about this success is that, at least superficially, we would not have expected it based on the observation that tropical cyclones always develop from pre-existing disturbances: One would suppose that the climatology and variability of tropical cyclones would depend at least in part on the activity of the triggering disturbances. But neither genesis indices nor my own downscaling take any account of such disturbances, and yet they simulate TC climatology and variability rather well. All of this suggests that the real control is mostly through the large-scale state and not through the activity of initiating disturbances.
If we could somehow eliminate Africa easterly waves, would TC activity drop in the Atlantic? Intuitively, we would think so, but perhaps the thermodynamic environment would gradually adjust so that Atlantic TCs would develop out of other or weaker disturbances, or maybe even spontaneously, as happens in cloud-resolving models at high enough temperature.
It is tempting to believe that if one has the right SST distribution in an AGCM, one will get the right distribution of TCs. On the other hand, to the best of my knowledge, there is no theoretical support for the idea that SST has any direct role in the physics of TCs. Rather, they “feel” something more like the evaporative potential at the surface. While the two quantities tend to co-vary, the relationship between them is not one-to-one. So, for example, raising SST by reducing the surface wind speed results in a much greater increase in evaporative potential than raising it the same amount by increasing the CO2 content of the atmosphere. This makes me skeptical of using AGCMs to interpret changes in TC climatology, since there is no guarantee of surface energy balance.
Finally, I do not think there is much mystery in why TCs and other forms of convection decrease with increasing global temperature. The most elementary models and theory show that the thermodynamic potential barrier to developing TCs is proportional to the saturation deficit of the lower to middle troposphere (above the boundary layer). When temperature increases at constant relative humidity, the saturation deficit increases. Boundary layer quasi-equilibrium also shows that, all other things being equal, convective mass flux decreases with increasing mid-tropospheric saturation deficit.
Keep up the good work, and thanks for starting this blog.
Kerry, thanks for dropping by. You raise several issues.
1) I agree that the success here, and even more clearly in your downscaling with random seeding, is mysterious if one thinks of the frequency of genesis as controlled primarily by the statistics of pre-existing disturbances. In particular, I can’t believe that our skill in interannual variability in the Atlantic, or that of similar models, is due to skill in simulating interannual variability of African easterly waves. It must be that that there is an abundance of “seeds” in some sense and that it is variations in the fertility of the large-scale environment that gives one the skill. (Of course, maybe we are over-optimistic in thinking that genesis frequency is low-hanging fruit — perhaps more deficiencies in all of these models will emerge in time.)
2) There are a lot of issues related to interpreting and understanding the limitations of prescribed SST simulations, and I would like to get back to this in another post. This issue comes up when thinking about the large-scale tropical flow, putting aside the tropical storm genesis problem, as illustrated here for example. (In fact, consistent with (1), thinking about how prescribing SSTs can alter the large-scale tropical flow, even in a perfect model, is presumably very relevant to the genesis issue as well.)
3) With regard to the reduction in genesis with warming, my working hypothesis is that it is related to the reduction in the climatological convective mass flux, which is dominated by disorganized convection. This reduction in the total amount of convection has nothing to do with genesis per se. We have corresponded about this a bit, but I am afraid that I am still confused. I am not sure if you are arguing that genesis frequency and total convective activity both happen to depend on the same parameter, or if the reduction in genesis is caused by the reduction in disorganized deep convection (the latter being my working hypothesis). In any case, I think this also deserves a post to itself.
Isaac and Kerry: Thanks for the interesting discussion.
On issue 3), I noticed a paper by Gualdi et al. ( https://journals.ametsoc.org/doi/abs/10.1175/2008JCLI1921.1 ) in which they analyzed the changes in CAPE, CIN and the height of LFC with 2xCO2 and 4xCO2 in a high-resolution coupled simulation and their analysis, such as on the PDFs of LFC height, seems in line with Isaac’s working hypothesis.
It seems the simulated tracks after the TCs move to mid-latitude more confined to the south of 40N while there are observed tracks between 40~60N over both NW Pacific and N Atlantic. What may the possible mechanism responsible for the biases be?
Jianhua, We have noticed this as well and have assumed that it is due to differing assumptions in the tracking algorithms as to when vortices are absorbed into the extratropical flow — i.e., it is not a real difference in the timing of the extratropical transition but a difference in the diagnostic. But we haven’t had the time to check this and study extratropical transition in this model.
Zhao et al. (2009) doesn’t show genesis locations, but a similar sort of study by Murakami and Wang (JClim 2010) also has a deficiency of cyclone tracks in the North Atlantic. They relate the deficiency to a severe underestimation of genesis frequency north of 25N, but don’t diagnose the cause of lack of modeled genesis. My suspicion, based on the relationship between genesis latitude and nature of generating disturbances noted by Elsner et al. (JClim, 1996), is that their global model is not properly handling the details of tropopause Rossby wave breaking, vortex rollup, and cutoff formation. The same problem (if it is a problem) may apply here.