

Posted on July 1st, 2014 in Isaac Held's Blog
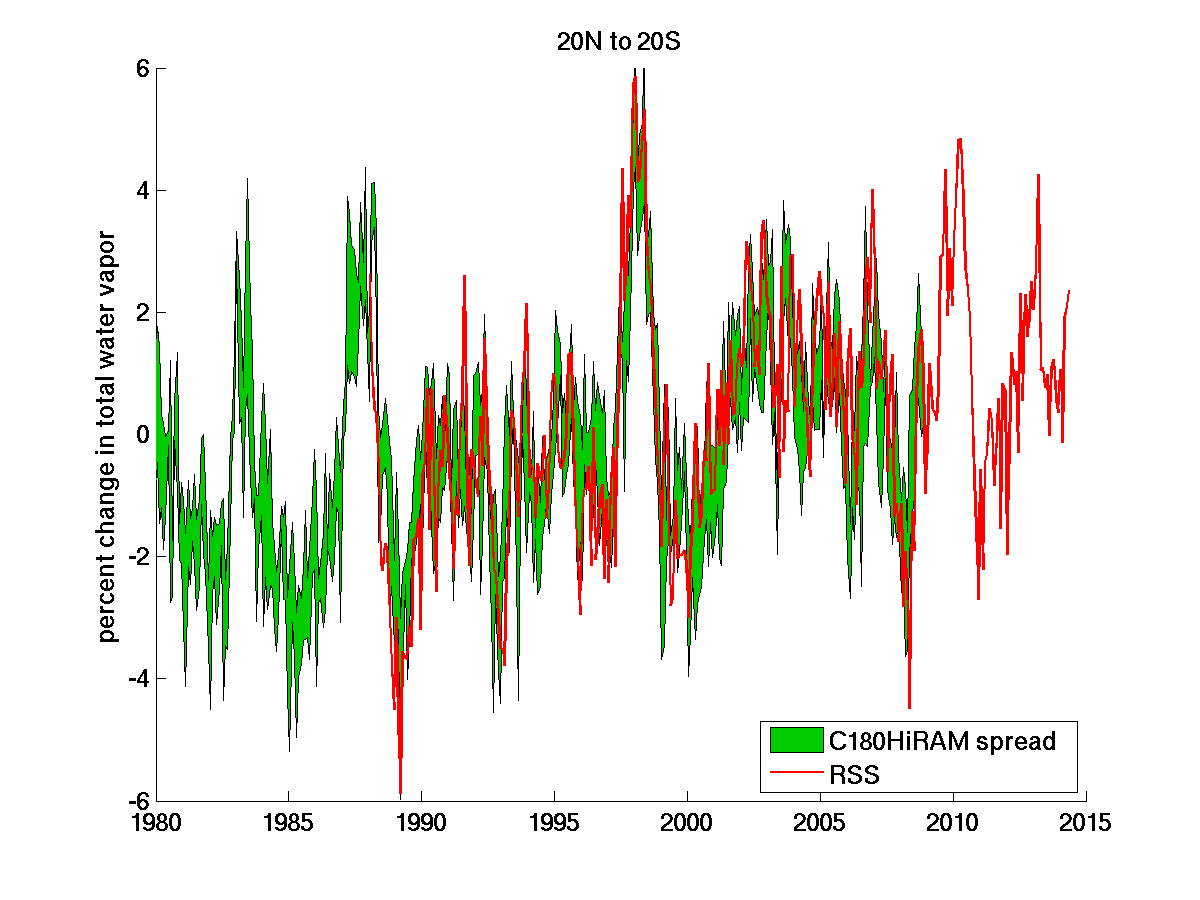 Percentage changes in total water vapor, vertically integrated and averaged over 20S-20N over the oceans only, comparing the RSS microwave satellite product (red) to the output of an atmospheric model running over prescribed SSTs (HADISST).
This is a continuation of the discussion in the previous post regarding the increase in water vapor near the surface and within the boundary layer more generally as the ocean surface warms. Models very robustly maintain more or less constant relative humidity in these lower tropospheric layers over the oceans as they warm, basically due to the constraint imposed by the energy balance of the troposphere on the strength of the hydrological cycle, and the tight coupling between the latter and the low level relative humidity over the oceans. Do we have observational evidence for this behavior? The answer is a definitive yes, as indicated by the plot above of microwave measurements of total column water vapor compared to model simulations of the same quantity. These are monthly means of water vapor integrated in the vertical. The observations are RSS Total Precipitable Water Product V7. The model is the 50km resolution version of GFDL’s HiRAM discussed in previous posts (on hurricane simulations , MSU trends , and land surface temperature trends) which uses observed SSTs and sea ice extent from HADISST1. for the lower boundary condition. Data are monthly means, deseasonalized by removing each month’s climatology defined by averaging over 1988-2007, and plotted as percentage changes from the climatological average over the same domain. The model results plotted are the spread of three realizations with different initial conditions (these are the runs from this model deposited in the CMIP5 database).
This is not asking a lot of the model. One gets about the same quality of fit for tropical averages by using the SSTs directly, instead of the model’s water vapor, and multiplying by 7%/C, roughly the fixed relative humidity value — see Fig. 7 on this RSS page for example, or Mears et al 2007. Any model that strongly couples the SST and the humidity in the lowest 2 kms of the atmosphere so as to maintain roughly fixed relative humidity would give this result. Fully coupled models, although they would not duplicate all of the interannual features of this time series of course, still give the same tight relation between SST and total water vapor. So this clearly forces us to take seriously the implications (of which there are many) of this increase in lower tropospheric water vapor as it amplifies in the future. It also gives us some extra confidence in the SST data in addition.
The observational estimate of the observed total water vapor over this tropical ocean domain is 41.75 Kg/m2. In the model, averaging over the 3 realizations I get 40.51, with negligible standard deviation across the ensemble. Putting aside any issues with absolute calibration of the satellite sensors and more mundane things such as consistent land-sea masks, let’s accept that the model is biased low 3%. This is of the same magnitude as the trends over the satellite era! Should we trust the result at all? Perhaps the radiative cooling is a bit too strong in the model’s troposphere, causing near-surface humidity to drop a bit so as to supply the required evaporation. Or maybe the boundary layer is 3% too shallow, reducing the vertical integral. Or even more likely, the bias if real is due to a combination of these and other small model deficiencies. Does this bias matter?
I have a hard time seeing how it does matter. We are admittedly typically interested in the absolute increases in water vapor, not the fractional increase. If the fractional changes in water with surface warming are ok, as the figure suggests, this bias suggests that the change in water vapor would also be underestimated by 3% — that is by 3% of 7%, or 6.8% rather than 7% per degree. I think we can agree that there are bigger fish to fry.
Absolute biases of this kind are easy to find in models, and are often the target of critics. But you have to have a cogent argument why a particular bias matters. There are some absolute biases that do matter, of course, but comparison of the size of the bias to the size of the response in question may not be the most relevant criterion for whether a bias matters or not.
Water vapor feedback is only weakly related to the vertically averaged water vapor discussed here. There are some frequencies, particularly those associated with what is known as the water vapor continuum, where the infrared emission from the lower troposphere reaches the tropopause, and a lot of the feedback due to solar absorption by water vapor comes from optically thin lines as well, but these don’t add up to a major fraction of the full water vapor feedback that you get from a model that maintains more or less constant relative humidity in the upper as well as lower troposphere. Do these results indirectly increase our confidence that the physics of the tropical upper tropospheric water vapor feedback is well simulated in our models?
I don”t think so. At a given level in the tropics above the boundary layer, water vapor concentrations are more closely related to what is going on above, not below, this level. Water is saturated by upward motion in the tropics, but most of this upward motion takes place in a small fraction of the total tropical area — even if this area changed it would not change area averaged relative humidity that much — and in these regions clouds tend to prevent the infrared emission by water vapor from reaching the tropopause anyway. What matter more is the humidity in the non-convecting drier areas. The relative humidity in those areas is determined by the previous history of air parcels arriving at the level in question, to first approximation. What was the temperature (and the pressure) at the higher levels at which these parcels were last saturated? This saturation event sets the mixing ratio of water vapor to dry air that is then conserved as the parcel descends. This has little to do with the humidity in the lower troposphere that dominates the vertical integral.
To finish up, here is a plot analogous to the one at the top, but for the Northern extratropics, from 20N to 45N, once again over oceans only. I have used a 5-month (1-2-3-2-1) smoother here to knock down the noise for aesthetic reasons.
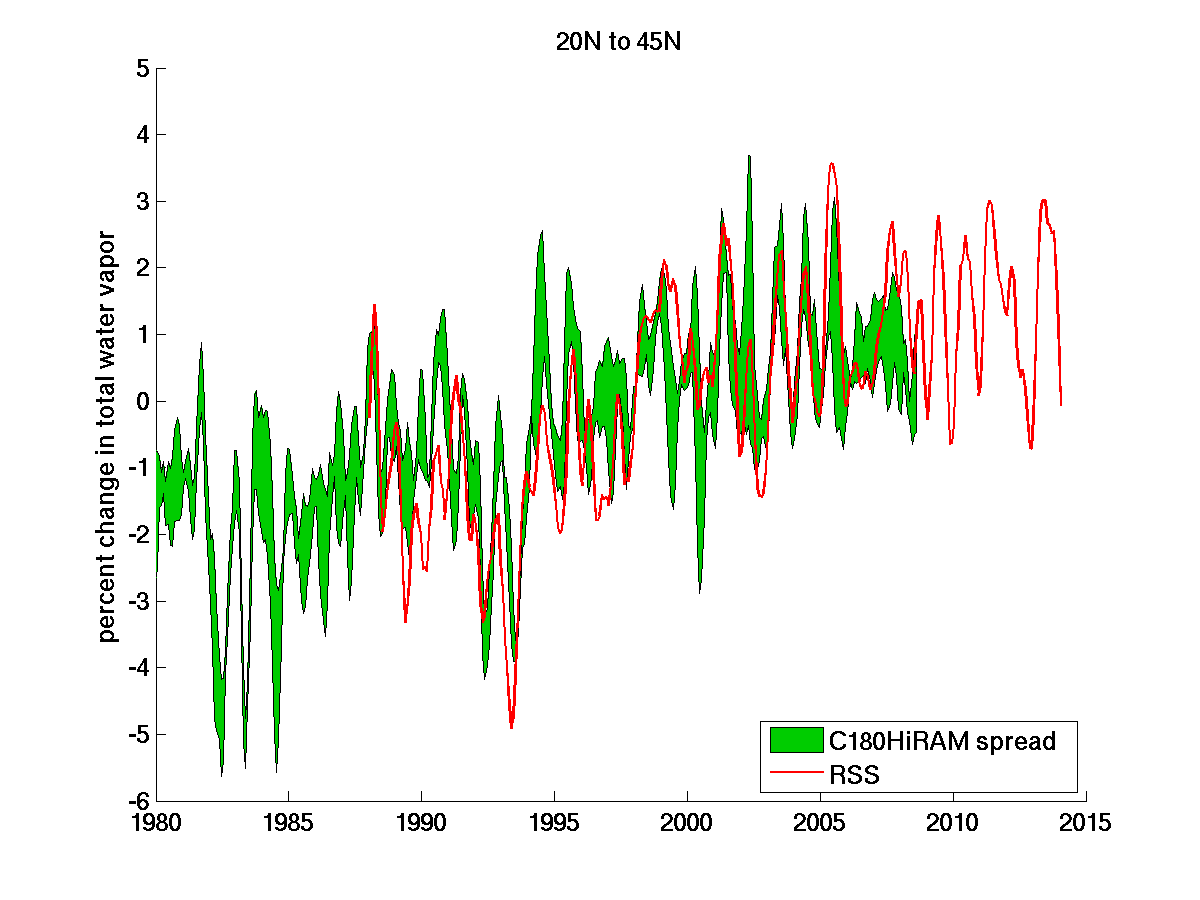 (The model bias is about the same here as in the tropics, about 2-3% low.) The agreement is pretty good here as well. This region is interesting because this is where midlatitude eddies are transporting water polewards systematically, with poleward moving moist air and equatorward moving dry air. The increase in poleward transport due just to this increase in vapor, without any change in the eddies themselves, causes an increased poleward transport of water. The divergence of this transport must be balanced by evaporation (E) minus precipitation (P) — so the eddies, by sucking water out of the subtropics, are reducing P -E there, simultaneously increasing P-E on the poleward side of the storm tracks — qualitatively consistent with the salinity trends discussed in post #14. (This figure also provides a slightly different perspective on the hiatus, without as strong an influence of ENSO variability.)
[The views expressed on this blog are in no sense official positions of the Geophysical Fluid Dynamics Laboratory, the National Oceanic and Atmospheric Administration, or the Department of Commerce.]
So, the water vapor feedback should tend toward zero at the tropopause, since temperature change at the tropopause is modeled to be zero.
That being the case, increasing the water vapor in the upper troposphere would increase the cooling rate of the upper troposphere.
Which would lead to subsidence.
But subsidence further increases the humidity gradient, leading to more cooling.
And since the area of subsidence exceeds the area of the convective regions, it would appear that the
humidifying of the upper troposphere might not match the humidifying of the boundary layer.
I was not discussing or defending models’ upper tropospheric water vapor feedback estimates in this post. But one reaction I have to your comment is that if you want to argue against the strong upper tropospheric water vapor feedback in models, you have to discuss something that the models are missing or distorting. Yet the dynamics that you mention in your comment (radiative cooling affecting the rate of subsidence which then transports vapor) is present in all climate models.
I lose you when you say that increased subsidence increases the humidity gradient. You have to think about the competition between this subsidence drying and some moistening process — presumably the outflow of vapor and condensate from convective plumes. Increased subsidence would result in drying if the moistening processes did not increase in strength proportionately. But if you increase the cooling rate you also increase the amount of convection and the strength of the source due to convective detrainment. Additionally, for warming at fixed relative humidity the cooling profile just moves upwards to first approximation (e.g. Ingram 2010). Constructing a simple radiative-convective model with a moisture budget that captures what you feel is the relevant balance would help me understand what you are claiming.
Obviously, the ENSO is involved in these figures. That means the start and end date trend will be depend on the timing of the ENSO.
One can go back to 1948 using NCEP Reanalysis and find that the ENSO is indeed, by far, the biggest control knob for water vapor and there is little long-term trend.
The point here is that vertically integrated water vapor over the oceans is tightly coupled to SSTs, with a constant of proportionality that models capture rather well. It would be very surprising if this relationship did not hold on longer time scales as well. And it would be very curious if this relationship broke down in reanalyses.. Are you sure that you are looking at vertically integrated water vapor over the oceans?
Paul, Isaac:
Dessler and Davis (2010, JGR) looked at this problem of the specific humidity trend in different reanalysis datasets (including NCEP, an outlier on the long-term trend), and the result is really they aren’t consistent and NCEP in particular is probably wrong for demonstrated reasons.
thanks for the reference — but I would still like to see the vertically integrated water vapor over the oceans only, averaged over 20S-20N in the reanalysis compared to the satellite total water paths. Is there enough data in these regions being ingested to make the reanalysis behave differently from any other model?
They did look at the tropics-only (but I don’t think oceans only) and NCEP still seems like an outlier in the long-term trends, which they argue is spurious. I don’t know enough about this product but I’d guess inhomogeneities would be the principle explanation.
The point in the post about the hiatus is interesting. If we accept the strong slaving between total water vapor and SST, then the trend in water vapor is an indirect verification of the surface temperature record (e.g., the hiatus is not an artifact of poorly sampled high-latitude regions, for example).
Isaac, I still wonder whether you are being a bit too harsh on the upper tropospheric connection here (even if the vertically integrated water vapor is not a rigorous defense of the water vapor feedback)? I guess a question I have is whether it would be possible to self-consistently concoct a climate that warmed up and moistened the boundary layer while drying the upper troposphere. If the specific humidity at a given point is set by the saturation specific humidity at the coldest point along a trajectory extending back in time to the saturating moisture source, and the vertical temperature profile is set by an adiabat, would it take a pretty large change in the trajectory statistics to take away from the picture that the upper troposphere moistens in global warming scenarios?
i am confident in upper tropospheric water vapor feedback, but it’s not the agreement seen above between observations and models in the lower troposphere that gives me that confidence. I emphasized this point here because it is a common source of confusion. Just to restate the argument, the memory of lower tropospheric humidity gets lost along trajectories that reach into the upper troposphere since the air is saturated through most of this ascent. Any memory that survives would have to come from the condensate.
Do these results indirectly increase our confidence that the physics of the tropical upper tropospheric water vapor feedback is well simulated in our models?
I don”t think so. At a given level in the tropics above the boundary layer, water vapor concentrations are more closely related to what is going on above, not below, this level.
Thank you Prof Held. How do these measurements and models handle cloud formation and precipitation? I recall you put up some cloud formation and dissipation simulation results. Is there additional knowledge of rainfall?
I appreciate your attention and response, if any.
Matthew
I interpret your question as asking whether similar comparisons have been made between model simulations with prescribed sea surface temperatures and the time series of tropical mean rainfall or cloudiness. There is quite a bit of work along these lines for precipitation especially, but observational uncertainties are greater than for vertically integrated water vapor, the coupling with the surface temperature is not as tight, and the results are less clear cut. See Fig. 1 in Allan and Soden 2007 for example. I am sure that there is more recent work as well.
I nonetheless wonder whether you are being just a little too harsh on the upper tropospheric connection here. Even supposing the vertically integrated water vapor is just not a rigorous protection of the water vapor suggestions? I assume a query i have is whether it will be feasible to self-continuously concoct a climate that warmed up and moistened the boundary layer while drying the upper troposphere. If the particular humidity at a given point is set by the saturation specified humidity on the coldest point along a trajectory extending back in time to the saturating moisture source, and the vertical temperature profile is set via an adiabat, wouldn’t it take an attractive large alternate within the trajectory facts to take away from the picture that the upper troposphere moistens in world warming eventualities?
It doesn’t follow from the assumption that the temperature follows a moist adiabat that the mixing of water out of the convection into the environment will occur at a warmer temperature. The temperature of this moisture source depends also on the height at which this detrainment occurs. See the discussion of “FAT” in post #30, for example.