

Posted on November 15th, 2014 in Isaac Held's Blog
 Fractional change in global mean precipitation (blue) and global mean (horizontally and vertically integrated) water vapor (red) as a function of change in global mean surface air temperature, over the 21st century in the A1B scenario in CMIP3 models. Redrawn from fig. 2 in Held and Soden 2006.
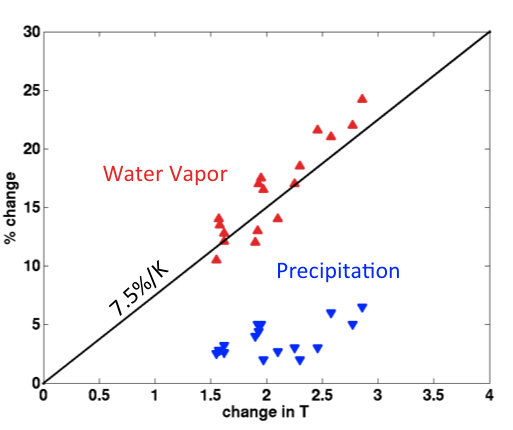
The figure at the top describes a very robust result in the responses to warming in global climate models: the fractional increase in the total amount of water vapor in the atmosphere is much larger than the fractional increase in global mean precipitation. While this figure shows the responses in CMIP3 models for a particular scenario of increasing forcing over the 21st century, the results from CMIP5 and different scenarios are all similar. This disparity in the magnitude of the increases in water vapor and precipitation and its important consequences for many other aspects of the climate response have been discussed since relatively early days in GCM simulations of climate change (e.g., Mitchell et al 1987). Perhaps the most fundamental consequence is the reduction in the vertical mass exchange between the lower and upper troposphere. That is, the “amount of convection” in the atmosphere decreases — or, by this particular measure, the atmospheric circulation slows down, especially in the tropics where a large fraction of this exchange takes place.
The connection with the atmospheric circulation is most easily understood by a simple argument that goes back at least to Betts and Ridgway 1988. Think of a picture in which parcels of air leave the boundary layer and enter the drier free troposphere, carrying a mass of dry air per unit time and unit area 


The slope in the temperature vs total water vapor plot is about what you expect from the Clausius-Clapeyron (C-C) dependence of saturation vapor pressure on temperature, but you have to be a little careful. For example, Back et al 2013 point out that the proportionality constant is smaller for more equilibrated climate changes, like glacial-interglacial differences. This is because the ratio of tropical warming to global warming is smaller when the climate is more equilibrated due to greater warming in polar latitudes, especially in the Southern Hemisphere. Since water vapor is dominated by the tropics, you get get less increase per unit global warming. But the bottom line is that fixed relative humidity in the lower troposphere still explains the results to first approximation. The proportionality constant is well-defined in the figure because the spatial patterns of warming are similar enough across these different models that there is a consistent relation between the changes in the globally averaged saturation vapor pressure in the lower troposphere and the globally averaged temperature change. As discussed in post #48, models beautifully reproduce satellite observations of vertically integrated water vapor averaged over the tropical oceans when these models use observed ocean surface temperatures as a boundary condition. So I think the relation between total water vapor vs temperature is very solid.
The global strength of the hydrological cycle is not determined by the C-C scaling but rather by the the energy balance of the free troposphere, the troposphere above the planetary boundary layer, where the release of latent heat associated with precipitation balances the radiative cooling to first approximation — see O’Gorman et al, 2012 for a recent review. (Focusing on the troposphere above the boundary layer allows you to avoid thinking about the turbulent sensible heat flux which is important in the boundary layer.) The radiative transfer is such that the radiative cooling (in our models) just can’t increase fast enough to keep up with the C-C increase in water vapor. If the atmosphere tries to increase precipitation a lot without balancing it with increased radiative cooling, the free troposphere will warm, creating a more stable environment which will eventually reduce the mass exchange and precipitation to rebalance things. It is interesting to explore the routes by which this rebalancing occurs, but whatever the mechanisms the reduction in mass exchange needs to occur for the atmosphere to re-equilibrate.
The observational record is not nearly as clear cut in this respect. In fact, there are claims (Wentz et al, 2007) that precipitation has increased at close to the C-C rate over the satellite era. Others see differences between models and observations in the tropics but estimate weaker overall trends in mean precipitation (see the O’Gorman et al review for some references). I am not aware of a convincing proposal for how atmospheric radiative cooling can increase by the amount needed to balance such a large increase in precipitation per unit warming– so my working hypothesis is that there is, in fact, a substantial difference between the rates of increase of water vapor and precipitation with warming. It is important to clarify this issue. Its resolution can affect estimates of climate sensitivity as well as circulation changes. You can change the atmospheric cooling of the free troposphere by either changing the fluxes at the tropopause or at the top of the boundary layer. If you do it at the tropopause you also affect climate sensitivity, with increasing radiative cooling per unit warming decreasing temperature sensitivity while increasing the sensitivity of the mean precipitation. If you do it at the bottom of the free troposphere without compensating changes at the top, as is the case if you modify how the absorption of solar radiation responds to warming you change the precipitation sensitivity with minimal change in temperature sensitivity. (modified for clarity on Nov. 17)
Regarding circulation changes, it is sometimes assumed that a reduction in vertical mass exchange in the troposphere, dominated by the tropics, would result in weaker mean tropical circulations — weaker Hadley and Walker circulations in particular. This doesn’t necessarily follow. A simple (oversimplified) picture of the tropics that I have discussed before in these pages is that most of the air is descending at a rate determined by the radiative cooling, with upward motion confined to a relatively small fraction of the area. If there are more than the average number of plumes of rising air in some large region, the Western Pacific warm pool or the ITCZ in the eastern Pacific say, the mean motion is upward, while the mean motion is downward where convective plumes are relatively scarce. In the regions of mean upward motion there has to be convergence of air at low levels, and low level divergence out of the regions with mean descent – and the surface flow can be thought of a driven by this pattern of convergence and divergence (rotation makes the connection between this convergence/divergence pattern and the flow itself a little counterintuitive). The average of the north-south flow around latitude circles is referred to as the Hadley circulation, while the Walker circulation is a strong westward flow at low levels over the Pacific. Even if the total mass exchange decreases, if the patten of convection becomes more organized the large-scale circulation could be enhanced — for example, if more convection moved to the regions where convection is already prevalent and even less occurred in the relatively quiescent regions.
But having said all that, if not much happens to the pattern of convection, you would expect the large-scale circulation to weaken on average. In models a lot of this weakening occurs in the east-west Walker circulation rather than the north-south Hadley circulation. It seems like the latter is prevented by other constraints from changing as much. Models generally do predict a weakening Walker circulation with warming, and I think that this overall weakening of the mass exchange in the tropics is part of the explanation for this model result. And this did seem to be an emerging signal in observations (Vecchi et al 2006) — until the recent 15 years or so in which the continuing hiatus/persistent La Nina/strong Walker circulation has muddied the picture of what the long-term forced trend might be. (I hope to return to this issue soon.)
[The views expressed on this blog are in no sense official positions of the Geophysical Fluid Dynamics Laboratory, the National Oceanic and Atmospheric Administration, or the Department of Commerce.]
Dear Dr Held,
I have two questions.
1. Your graph of water vapor vs temp is linear, but the water vapor pressure is a supralinear function of temperature — I got this from the Wikipedia entry on water vapor pressure. They caution that some of the entries in the table have been corrupted.
2. What do you think of the Romps et al paper published recently in Science?
http://science.sciencemag.org/content/346/6211/851
They report that a 1C increase in temp will produce an 11% (+/- 5%) increase in lightning ground strike rate, which seems to require an 11% increase in the rate of energy transport from surface to upper troposphere.
I appreciate your attention.
Matthew
1) Over the 3K range of relevance for the plot the curvature of the saturation vapor pressure would be hardly noticeable, I believe
2) Romps et al argue that lightning goes like P times CAPE, where P is the precipitation and CAPE is the Convective Available Potential Energy, which you can think of as a measure of the departure of the temperature profile from a moist adiabat. The fractional changes in CAPE dominate the changes in lightning in their estimate, not the fractional changes in P which are much smaller. You can get a big CAPE change from small change in the absolute departures from a moist adiabat because these departures are small to begin with. There is no requirement for an increase in the energy transport comparable to the increase in lightning. Not sure where you get that idea.
I enjoyed the post. One aspect that might be worth adding is that while the precipitation scaling holds generally, the further approximation
  for the mixing ratio difference may be inaccurate (as stated in the post) and may even lead to qualitatively different inferences about changes in vertical mass exchange
  than other plausible approximations.
For example, Betts and Harshvardhan (1987) suggested that the mixing ratio difference can be approximated by , where
  is the derivative of the saturation specific humidity
  with respect to pressure
  , and
, and  is a pressure difference across a layer of substantial water vapor transport. In situations when the relevant pressure difference
  can be taken to be fixed under climate change, the mixing ratio contrast would scale with the gradient of saturation specific humidity with respect to pressure (i.e., with the moist-adiabatic static stability). This generally increases more slowly with temperature than the saturation specific humidity
  (or the boundary-layer mixing ratio
  ). For example, at 290 K and 825 hPa, the gradient
  increases at 2%/K, whereas
  increases at 6.4%/K. If precipitation increases at 2.5%/K (typical for climate models), the mass exchange
  would strengthen by (2.5-2)%/K = 0.5%/K if
  scales with
  , rather than weakening by (2.5-6.4)%/K=-3.9%/K if
  scales with
  . Such qualitatively different responses are seen in a few simulations described in this paper (where these arguments are also reviewed in greater detail).
Of course, there are a reasons to assume does not stay fixed as the climate changes (mass fluxes get deeper); assuming it is fixed may not give a great estimate of the vertical mass exchange. But it’s probably good to be aware that the magnitude of any vertical mass exchange weakening may be considerably smaller than what is implied by assuming
  . This is seen, e.g., in Vecchi and Soden (2007). It is even possible that in some situations the vertical mass exchange strengthens.
Tapio,
Thanks. How the effective in this kind of argument varies with warming of the tropics is clearly something to focus on. We also need to be aware when using idealized models that the idealizations that one uses may be distorting this dependence.
As an aside, I really appreciate it if people actively working on these issues elaborate on what I say — especially to criticize the posts as oversimplified or otherwise misleading.
That’s a very interesting point about whether we can assume , and what that implies for circulation change. Perhaps the simplification of
  can be recovered if we only consider the deep convective circulation, and neglect shallow vertical mixing. In this case
  is much greater than
  at the level of deep convective detrainment, and similarly
  is generally much smaller than
  in regions of descending air, away from convective plumes. This is consistent with the behaviour of column-integrated convective mass-flux in GCMs, which does weaken with warming across models (as shown in this paper).
Best regards,
Rob
The simplification may warrant more study, as the mixing of deep convection with environment is quite strong. The mixing potentially allows quite some vapor to reenter the boundary layer without being converted into precipitation, making it hard to tell whether is adequately small.
The mixing of deep convection with environment can be partitioned into entrainment and detrainment. Romps and Kuang (2010, JAS) shows that “undiluted updrafts are negligible above a height of 4–5 km and virtually absent above 10 km”, which is consistent with observational studies by Ed Zipser. So the convection draws considerable vertical mass flux from the levels above boundary layer. Meanwhile, the deep convection also “leaks” heavily via detrainment. The ratio of entrainment and detrainment was recently examined with LES. The detrainment mostly dominates entrainment above the boundary layer (Romps 2010, JAS). This dominance implies that the deep convection leaks quite some water vapor after the updrafts leave the boundary layer. The leaked vapor may return to the boundary layer directly, or may be consumed by later precipitation. This alone has made it hard to intuitively scale for deep convection, even if we neglect processes like the evaporation of precipitation.
There are some additional concerns about focusing on the deep convection, especially when its contribution to and
and  is not isolated from shallower systems. The treatment implicitly assumes that the deep convection dominates
  and
and  . However, this at least doesn’t hold for the tropical precipitation. For example, the “stratiform rain” could account 25% to 60% of the precipitation over tropical Pacific (Schumacher and Houze 2002; J Climate). The shallow precipitating systems are inefficient in converting vapor into precipitation, leaving much vapor in the vertical mass flux unused. Compared with deep convection, the shallow precipitation has very different profiles of vertical mass transport. For example, the shallow precipitation contributes to a shallow meridional overturning circulation over East Pacific (Zhang et al. 2004, J Climate; Nolan et al. 2007, JAS). Interestingly, the vapor mixing in the lower and middle troposphere appears to impact the moisture content in boundary layer and involve with considerable climate sensitivity (Sherwood et al. 2014, Nature).
That said, the discussion is quite insightful and inspiring. The perspective could be useful for understanding the behaviors of complex models. For example, most current reanalysis models have discrepancy in the strength and pattern of mass transport; they also have disagreement with the observed precipitation (e.g., Stachnik and Schumacher 2011, JGR). These issues are perhaps tied with how precipitation is parameterized, which ultimately impacts the value of .
.
Thanks for the comment. Given the complexity of turbulent moist convection, a simple argument like this should be thought of as providing an approximate constraint on the behavior of the tropics as it warms, not the complete answer. But it is interesting that one can generate a picture similar to this one by focusing on the dry subsidence regions, assuming that the moist adiabat is maintained as climate warms, as discussed in Knutson and Manabe 1995
Thanks for the reply. If my understanding is correct, the subtropical version is more directly related with the energy balance – moistening the subtropical free troposphere, while keeping the moist adiabat the same, would reduce the radiative cooling and the
  associated with subsidence. Based on this argument, one would deduct that the Hadley circulation slows down in a warmer (and perhaps moister) climate, somewhat similar to the original post’s picture.
Speaking of what may induce subtropical moisture changes, Sherwood et al. (2010) has described a useful conceptual model. Their basic idea is that the subtropical moisture balance involves with moistening from the deep tropics and drying from higher latitudes. The review paper further suggests that tropics supplies most of the subtropical moisture, but the amount of air mixed from higher latitudes is much larger, especially near the driest mid-troposphere in subtropics.
Sherwood et al. (2010) cited an earlier study (Galewsky et al. 2005), which is coauthored by you and includes some fascinating ideas. One of them is, “subtropical humidity could change independently of any tropical mechanism if changes in extratropical eddies change the statistics of the extratropical drying”. Combining the idea with the previous discussion about subtropical , one seems to have a path for extratropical eddy activity, via the moisture, to modulate the Hadley circulation (at least its descending branch).
Some curious survey suggests that tracking free-troposphere moisture with reanalysis datasets is plagued by uncertainty (maybe some smart analysis of satellite data works?), possibly leaving the idealized modeling as the only feasible tool. The modelling has been successful in linking eddies with Hadley circulation via the angular momentum, as described by Tapio Schneider and colleagues. But adding moisture to their dry model apparently introduces new complexity, which may hinder any attempt of validating the “eddy & moisture” guess.
Unsure whether the guess is actually something new and scientifically sound. But since the idea has been lingering for a while, any input will be appreciated.
Gan, the simplest argument for reduced tropical mass flux based on the subsidence regions does not refer to any change in humidity in those regions — it just uses the fact that the dry stability of the air increases with warming if the warming is more or less moist adiabatic, so you get less subsidence for the same radiative cooling.
Hi Isaac,
This is a silly question I’m sure, but why do we not think about any change in “dry” atmospheric mass flux in this chain of reasoning, i.e., since water vapor is a small component of the atmosphere by mass (or volume)?
Chris,
Not sure that I understand the question. I am thinking of the mass exchange here as the exchange of the dry component (everything other than water vapor). To close the mass budget including the vapor you would have to consider the flux of condensate as well.
OK, thanks- I completely misunderstood.
I suppose I am trying to mentally reconcile the framework outlined here with how Hadley cells would intensify/weaken in a pure dry limit (e.g., perturbations about a Snowball Earth), e.g., using axisymmetric theory, etc, and the factors that balance tropospheric radiative cooling in that sort of regime.
Maybe I misunderstood — in any case, the limit of a very cold (snowball) tropics is a different ballgame, once latent heating becomes negligible compared to sensible heating.
Dear Dr. Held,
I totally agree with your explanation on the relationship between the reduction of vertical mass exchange and circulation change. The reduction of vertical mass exchange is deduced from total energy conservation. Thus, it only requires the global total vertical mass exchange decreasing. However, in some studies, circulation change is divided into several parts, including a part of circulation slowdown often defined to be proportional to the climatological circulation. I don’t agree with this process. The decrease of global total vertical mass exchange does not mean the regional circulation/convection should proportionally decrease.
Best regards,
Ping
Dear Dr Huang,
I guess that’s our study (see here) that you’re referring to, where we partition regional circulation change into one part due to a weakening circulation, and another due to spatial shifts in convection (associated with e.g. SST pattern change, land-sea temperature gradient change). I agree with you that the global mean moisture and energy budget arguments outlined above by Professor Held do not constrain circulation change on a regional level.
However in GCM projections the response of regional convective mass-flux to warming is negatively proportional to the climatological mass-flux, i.e. regions with greater present-day convection tend to have larger reductions under warming. This emergent behaviour across GCMs, and its consistency with a dynamical argument for how the circulation weakens (Ma et al. 2013), form the justification for partitioning regional circulation change, not global mean constraints.
Of course this hypothesis is only the simplest way that the circulation could weaken that is consistent with GCM projections, and may require significant alteration or extension, but it does provide a useful framework for analyzing regional precipitation change.
Best,
Rob