July 23rd, 2012
Key Findings
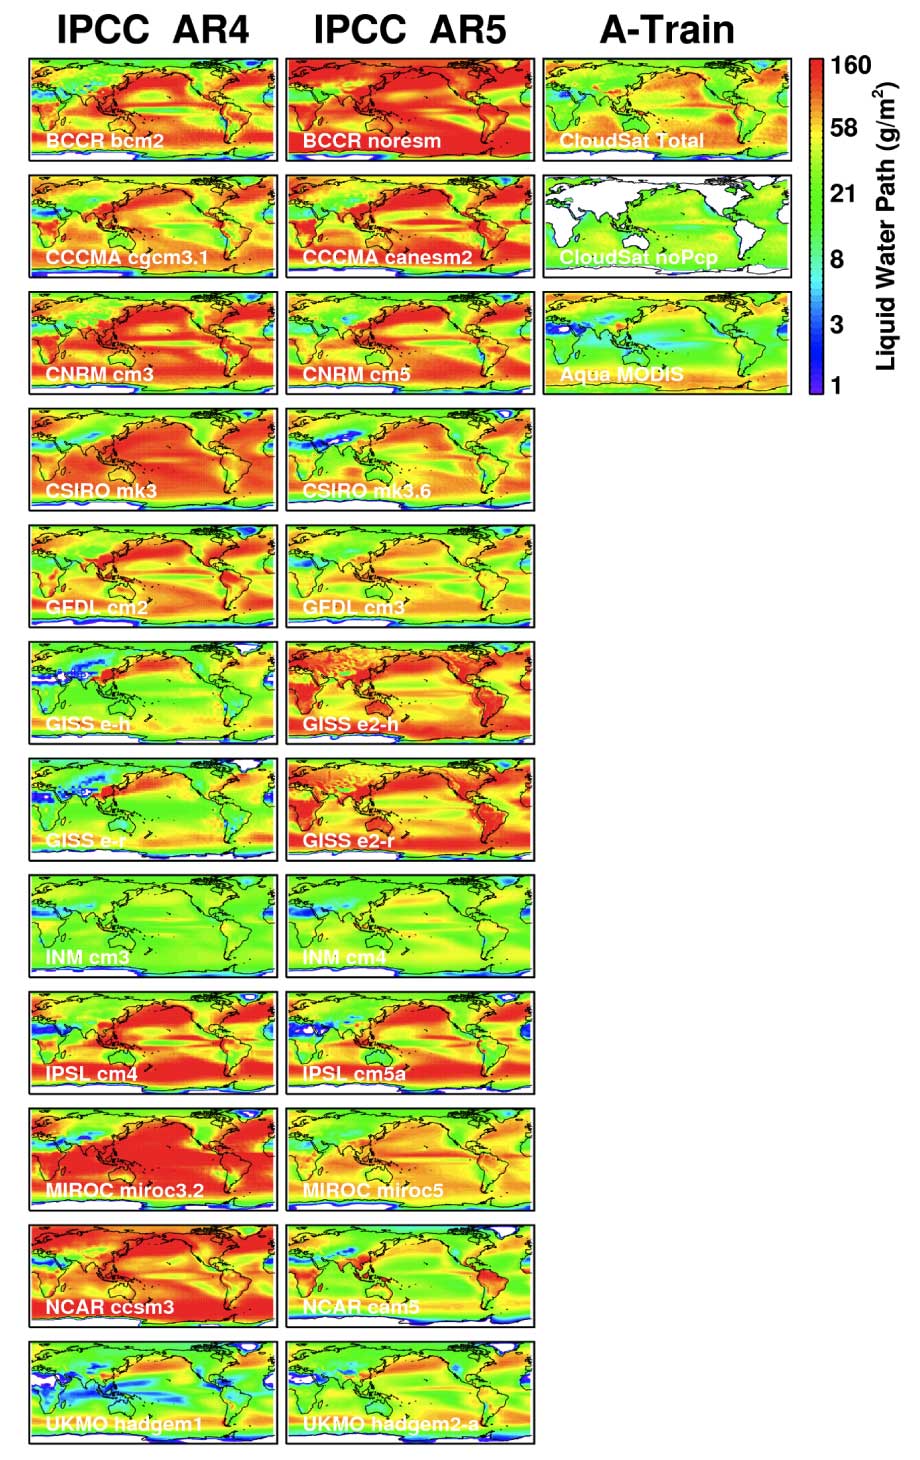
- Scientists from Jet Propulsion Lab, GFDL, and 12 other major modeling centers, evaluated their CMIP5 climate model simulations of clouds and water vapor using satellite observations
- About half of the CMIP5 models, including GFDL’s CM3, have improved simulations of clouds relative to their CMIP3 versions. CMIP3 models were a critical component of the IPCC AR4 in 2007, and CMIP5 models will be used in the upcoming IPCC AR5 assessment.
- Despite improved cloud simulations in about half of the models, major challenges remain, especially in the simulation of clouds and water vapor in the upper troposphere.
Jonathan H Jiang, Hui Su, Chengxing Zhai, Vincent Perun, Anthony D. Del Genio, Larissa S. Nazarenko, Leo J. Donner, Larry Wayne Horowitz, Charles J. Seman, Jason Cole, Andrew Gettelman, Mark Adam Ringer, Leon D. Rotstayn, Stephen J. Jeffrey, Tongwen Wu, Florent Brient, Jean-Louis Dufresne, Hideaki Kawai, Tsuyoshi Koshiro, Watanabe Masahiro, Tristan Simon LEcuyer, Evgeny M. Volodin, Trond Iversen, Helge Drange, Michel dos Santos Mesquita, William G. Read, Joe W. Waters, Baijun Tian, Joao Teixeira, Graeme L. Stephens. Journal: Journal of Geophysical Research. DOI: 10.1029/2011JD017237
Summary
Clouds and water vapor are among the difficult features of the atmosphere for global climate models to simulate because they are affected by physical processes that operate over very small areas compared to the weather patterns that the models explicitly calculate. The authors used satellite data to assess the representation of clouds and water vapor simulated by several climate models that will participate in the Intergovernmental Panel on Climate Change (IPCC) Fifth Assessment Report (AR5).
This paper compares the new generation of models, including GFDL’s CM3, to state-of-the-art satellite data sets produced by NASA’s Jet Propulsion Laboratory. Using these data sets, the authors were able to examine the models in greater detail than was previously possible, including the vertical distribution of cloud and water vapour.
The study finds measurable improvements in the more recent models relative to the previous generation of climate models, in simulating the amount and the vertical and geographical distribution of clouds and water vapor over the globe. For clouds and water vapour over the tropical ocean, the study concludes that both the largest spread among models and the largest differences between models and satellite observations are at high altitudes, where cirrus clouds and anvil clouds associated with thunderstorms form.