September 18th, 2013
Key Findings
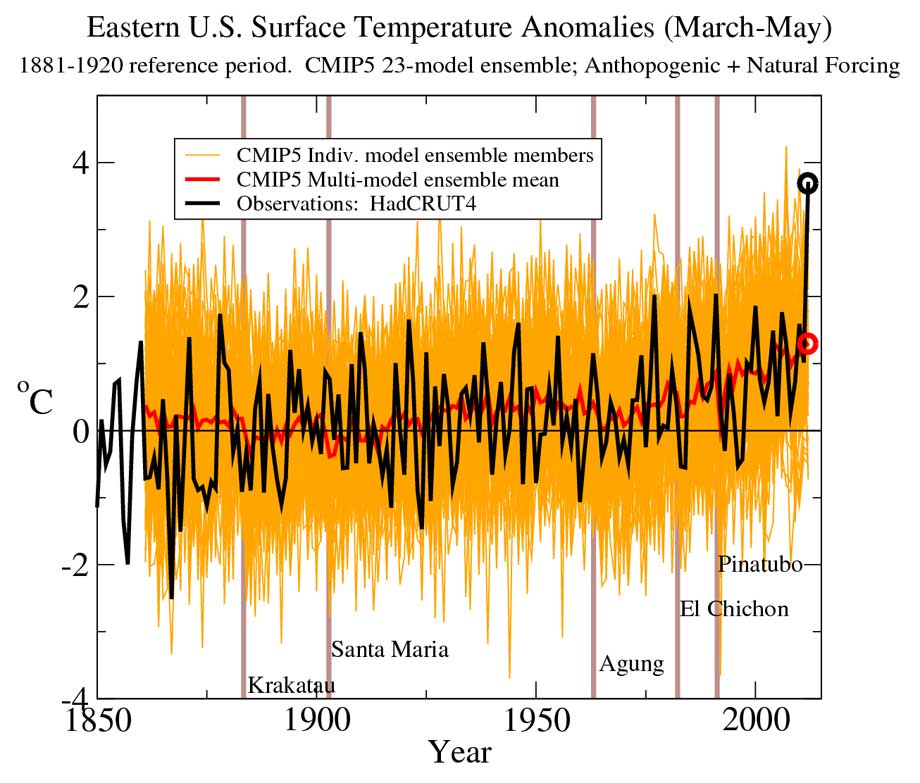
- Very pronounced, record spring-time warmth occurred over the eastern U.S. during March-May 2012—and the warmth was very likely attributable, at least in part, to anthropogenic forcing.
- According to the CMIP5 model simulations, about 35% of the magnitude of this March-May anomaly was attributable to external forcing–primarily anthropogenic in origin such as increasing greenhouse gases.
- According to the CMIP5 models, long-term warming due primarily to anthropogenic forcing has increased the risk of a warm anomaly in the eastern U.S. as large as that in March-May 2012 by about a factor of 10.
- From a global perspective, extreme seasonal and annual mean temperatures occurring during 2012 were very skewed toward warm extremes (6-13% of area), rather than cold extremes (1%). Here, we define extremes as warm or cold anomalies that rank 1st, 2nd, or 3rd in the record.
Thomas R. Knutson, Fanrong Zeng, and Andrew T. Wittenberg. Journal: Bulletin of the American Meteorological Society (See pp. S19-S23 of this collection of studies on 2012 extremes).
Summary
The authors compared observations to model results, using 23 different CMIP5 models to simulate internal climate variability and the response to anthropogenic and natural forcing. The models were used to investigate the causes of the unusual warmth during March-May 2012 that occurred over the eastern U.S. The 20th century warming trend that was observed in this region is consistent with the CMIP5 multi-model ensemble results of All-Forcing runs but not consistent with model runs that did not include external forcing. The long-term trends in the models are predominantly due to anthropogenic forcing. Therefore, we interpret the extreme warmth of March-May 2012 over the eastern U.S. as very likely attributable, at least in part, to anthropogenic forcing. The CMIP5 models’ central estimate of the contribution of anthropogenic forcing to the March-May 2012 anomaly is about 35% in terms of magnitude. Moreover, the model results suggest that the risk of a warm anomaly in the eastern U.S. as large as that seen in March-May 2012 has now increased by about a factor of 10 due to long-term climate warming—primarily anthropogenic in origin.
From a global perspective, extreme seasonal and annual mean temperatures during 2012 in different regions around the globe were very skewed toward warm extremes (6-13% of area), rather than cold extremes (1%). For this paper, we define extremes as warm or cold anomalies that rank first, second, or third in the historic record. The most prominent example of large-scale record seasonal warmth for 2012 occurred over the eastern U.S. during March-May.
To detect the eastern U.S. springtime warming trend and attribute it to primarily anthropogenic forcing, the authors used a multi-step attribution approach. This type of assessment first attributes an observed change in a variable of interest (in this case, seasonal mean temperature extremes) to a change in climate and/or environmental conditions (in this case, century long trends in seasonal mean temperatures), then makes a separate assessment of the causes of the long-term trend in seasonal mean temperatures.
A number of previous studies have pointed to the lack of a pronounced long-term warming trend over the eastern U.S. This study shows that at least for the region and season analyzed here, a long-term warming signal now appears to be detectable over the eastern U.S. (though interestingly still not for some of the individual grid points within the region).
Application of methodologies such as those described in the study can help policymakers and other stakeholders to interpret weather and climate events, such as extreme seasonal temperature anomalies, in the context of ongoing long-term climate warming.
Known uncertainties:
There remains substantial uncertainty in the simulated internal variability, historical forcings, and climate sensitivity at the regional scale.