

Trajectory Sensitivity of the Transient Climate Response to Cumulative Carbon Emissions
J.P. Krasting, J.P. Dunne, E. Shevliakova, R.J. Stouffer. Accepted to Geophysical Research Letters, DOI: 10.1002/2013GL059141.
Summary
The robustness of TCRE is tested using an Earth System Model (GFDL-ESM2G) forced with 7 different constant rates of carbon emissions (2 GtC/yr to 25 GtC/yr), including low emission rates that have been largely unexplored in previous studies. We find the range of TCRE resulting from varying emission pathways to be 0.76 to 1.04 ºC/TtC. This range, however, is small compared to the uncertainty resulting from varying model physics across the CMIP5 ensemble. TCRE has a complex relationship with emission rates; TCRE is largest for both low (2 GtC/yr) and high (25 GtC/yr) emissions and smallest for present-day emissions (5-10 GtC/yr). Unforced climate variability hinders precise estimates of TCRE for periods shorter than 50 years for emission rates near or smaller than present day values. Even if carbon emissions would stop, the prior emissions pathways will affect the future climate responses.
Methodology
Using the GFDL-ESM2G coupled climate-carbon cycle model developed by NOAA-GFDL, TCRE was evaluated by forcing the model with 7 constant carbon emission rates (2, 3, 5, 10, 15, 20 and 25 GtC/yr). This differs from previous studies that used a compounding trajectory of CO2 concentrations (i.e 1pctCO2 experiment). Three ensemble members of each experiment were integrated for 200 years (400 years in the 5 GtC year-1 case and 1300 years in the 2 GtC/yr case) in order to achieve at least a doubling of atmospheric CO2. A second set of experiments was conducted to test the applicability of TCRE to relate past cumulative emissions to future warming. In three additional experiments initialized from the time of CO2 doubling in the 2, 5, and 25 GtC GtC year-1 scenarios, the emissions were set to zero and the model was run for another 200 years with the land and ocean continuing to exchange CO2 with the atmosphere.
Known uncertainties
This study confirms the robustness of the proportionality between surface air warming and ongoing cumulative carbon emissions. This study, however, demonstrates a larger response dependence on carbon emissions pathway when forced by constant “low” carbon emissions that take many centuries to double atmospheric CO2. This trajectory dependence is related, in part, to oceanic heat and carbon uptake. These processes are dependent on ocean mixing and the equilibrium climate sensitivity, which vary from model to model. The results from these experiments also indicate that the mechanisms that give rise to the proportionality depend of the emissions pathway and possibly depend on processes other than oceanic heat and carbon uptake, as demonstrated here by the varying terrestrial response to different carbon emission rates.
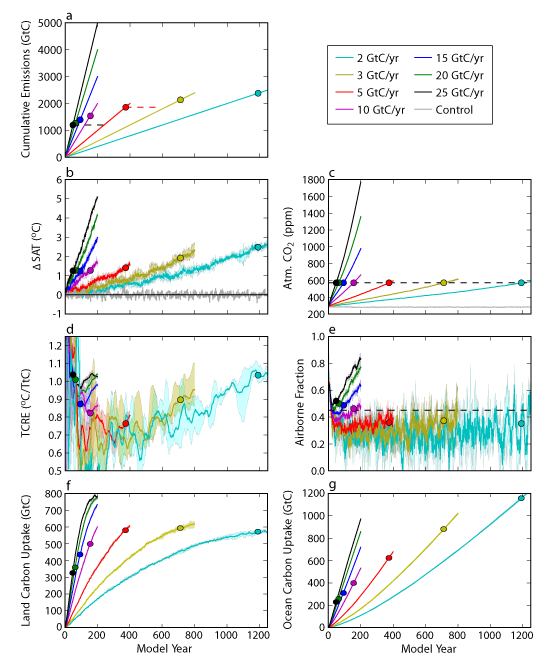
Figure 1: Ensemble mean (solid line) and range (envelope). a. cumulative carbon emissions (GtC) vs. time (note the different number of years on the x-axis), dashed lines represent the zero emissions experiments; b. Global surface air temperature response (°C); c. Model-predicted atmospheric CO2 concentration (ppm); d. 20-yr smoothed TCRE (°C/TtC); e. 20-yr smoothed atmospheric fraction of carbon; f. cumulative land carbon uptake (GtC); g. cumulative ocean carbon uptake (GtC). Dots indicate the time of atmospheric CO2 doubling.
Click here to access the manuscript that has been accepted.