Posted on February 23rd, 2015 in Isaac Held's Blog
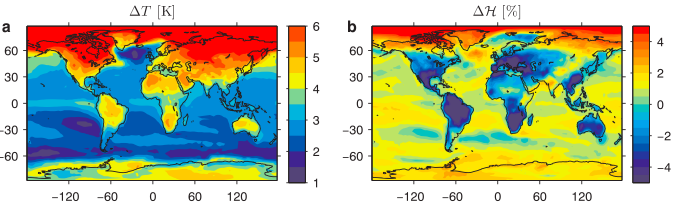
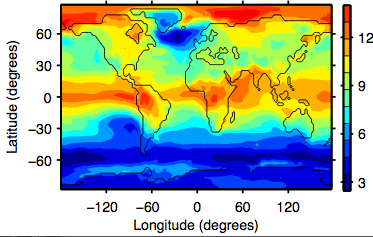
Multi-model median of changes in near surface a) temperature, b) relative humidity, and c) equivalent potential temperature between the historical simulation (1975-2004) and the RCP8.5 (2079-2099) simulations in CMIP5. From Byrne and O’Gorman 2013.
In global warming simulations the surface air over land warms more than over the oceans in the tropics, while the relative humidity decreases over land, increasing a bit over the oceans, as illustrated in panels a) and b) above from a recent paper by Michael Byrne and Paul O’Gorman. A quantity that is relevant for the convective instability of the atmosphere and the profile of temperature on a rising air parcel is the equivalent potential temperature,  . Strikingly the increase in is quite uniform in the deep tropics, irrespective of whether the underlying surface is land or ocean. This is not an accident and provides us with a simple way of thinking about increasing heat stress with warming.
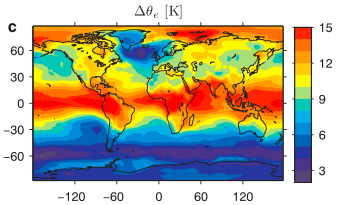
As an air parcel rises adiabatically it maintains its entropy, or its value of (the entropy of an air parcel is  ). increases with increasing temperature and with increasing humidity. Suppose two parcels start out near the surface, one relatively cool and moist (over the tropical ocean) and the other warm and dry (over tropical land), but with the same . As the parcels rise and cool due to adiabatic expansion, with their temperatures decreasing at 9.8K/km, the dry adiabatic lapse rate, they will eventually become saturated, with the dry warm parcel needing to be raised higher to reach its lifting condensation level. Above the level at which they are both saturated the temperatures should be equal, and remain equal as they are raised further, the temperatures now following a moist adiabat due to the latent heat release that accompanies saturated ascent.
What is the dynamics underlying this picture? Suppose we know the mean ocean temperature in the tropics. In previous posts I have discussed the case for the relative humidity near the surface over the oceans being strongly constrained. So let’s take the mean oceanic as known, which through convection sets the temperature profile of the free troposphere (given the last two posts, perhaps it is better to think of the mean precipitation-weighted value of as setting the free tropospheric temperatures). Land relative humidity is not as strongly constrained, so the best we can do, until we agree on a theory for the magnitude of the continental drying, is to ask about the temperatures consistent with a given amount of drying (circling back to the humidity question when ready to do so).
Now think of the near surface temperatures as being warmed by the sun, convecting only weakly if temperatures are not sufficient to produce oceanic ‘s, because a rising parcel’s density will be higher than that of the environmental air at the same level. Once this critical is reached, substantial convection to the upper troposphere is possible. But moist convection doesn’t just mix the air vertically, it warms the air locally and generates a circulation with net upward motion in the convecting regions, converging air at low levels and diverging air aloft – a circulation that transports energy away from the convecting region. So one can imagine that this energy transport is a strongly nonlinear function of land temperature, kicking in hard to prevent and tropospheric temperatures larger than the environmental values controlled by the oceans (until the amount of convection is strong and wide-spread enough that it can effectively wrestle control from the oceans and control its own environment).
Taking this picture at face value, we should expect the climatological over land and ocean in the tropics to be quite uniform, or at least that the oceanic value should be an upper bound on the land values. And we should expect the change in in response to global warming to be uniform as well, providing a simple explanation for the result in panel c above. As discussed in Byrne/O’Gorman paper, the change in is more uniform within the tropics than the climatological distribution. See also Joshi et al, 2008. I would like to understand this distinction better.
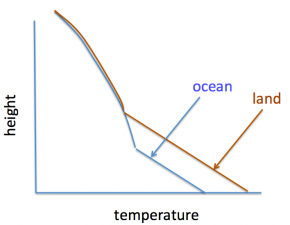
Turning to the issue of heat stress: The concept of wet bulb temperature is the usual starting point for discussions of the effects of warming on the comfort of human beings. To compute the wet-bulb temperature, assume that you have a reservoir of water (in your skin for example). Start with the temperature  and the specific humidity
  (the density of water vapor divided by total density of the air), then take some energy out of the air (at fixed pressure) and use it to convert water in the reservoir to vapor. Continue to do this, lowering the temperature and increasing the humidity, until the air is saturated, at which point you are at the wet bulb temperature,
  . That is,

Here  is the latent heat of evaporation, and
  is the specific humidity at saturation at the temperature and at the pressure that has been fixed throughout .
  is the enthalpy of moist air. So the wet bulb temperature and the enthalpy are the same thing, in the sense that there is a one-to-one correspondence between them.
[What I have defined here is sometimes referred to as the thermodynamic wet bulb temperature. It can differ in principle from what a wet-bulb thermometer measures, for which the rates of exchange of heat and water vapor between the air and the reservoir play a role. See here for a discussion of the distinction. Also, heat stress is often quantified with the wet bulb globe temperature, the major component of which is the wet bulb temperature, but which also involves the temperature itself as well as the amount of sunlight. See Willett and Sherwood 2012 and Dunne et al 2013.
There is a close connection between the enthalpy, or the wet bulb temperature, and . One can write (corrected 3/10/15)
where  is potential temperature of dry air, the temperature of the air if brought adiabatically to a reference pressure, and
  is the temperature at the lifting condensation level discussed above. Perturbing this expression, you get

where I have ignored  compared to
  and approximated by the surface temperature (these are all absolute temperatures). Experts in thermodynamics of moist air will be nervous about the assumptions needed to justify these expressions — ignoring the partial pressure of water vapor compared to that of dry air, the temperature dependence of , the effect of the water vapor on the heat capacity of the air, etc — these small effects do end up making a significant difference when looking at the climatology but I think they are less important when thinking about perturbations of the magnitude of relevance here. Ignoring the surface elevation over land and referencing the potential temperature to a typical pressure at sea level, so that
  we get

So the change in  should have more or less the same structure as the change in but with a somewhat smaller amplitude overall.
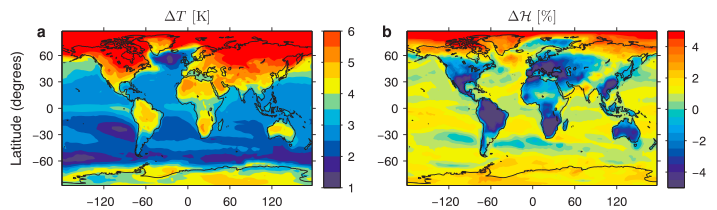
Michael Byrne has kindly generated  from the same model simulations as used in the figure above, confirming this qualitative picture.
 In particular, the increases in enthalpy and, therefore, wet bulb temperature, are of similar magnitude over land and ocean in the tropics. Over the oceans, the relative humidity is high, so the change in wet bulb temperature is close to the change in temperature itself. (Students may wish to check this, assuming a temperature of 27C and a relative humidity of 80%, and then increasing temperature at fixed relative humidity and comparing the resulting change in web bulb temperature to the change in temperature.) Therefore, the change in wet bulb temperature over land is comparable to (and, by the previous arguments, controlled by) the mean change in ocean temperature.
Another implication of this line of argument is that the model spread in the predictions for increases in the enthalpy or wet-bulb temperature over tropical continents should be smaller than the spread in temperature and in humidity separately. This is what one sees, with this cancellation carrying over to changes in extremes as well as mean responses (Fischer and Knutti 2013). Comparisons of model simulations of enthalpy or wet bulb temperature trends in the past with observations should be a high priority (as advocated from a somewhat different perspective by Pielke, et al. 2004)
The high extremes in wet bulb temperature are obviously of importance for heat stress. Values of wet bulb temperature approaching body temperature are of special concern, given the difficulty in cooling the body by evaporation under these conditions (Sherwood and Huber 2010) We can be thankful that ocean temperatures in the tropics have warmed less rapidly in recent decades than the average projection from our climate models. The stakes are high.
(Thanks also to Steve Garner for some helpful discussions while writing this post.)
[The views expressed on this blog are in no sense official positions of the Geophysical Fluid Dynamics Laboratory, the National Oceanic and Atmospheric Administration, or the Department of Commerce.]


Nice post Isaac. I have only one quibble: wet bulb temperature is *not* the usual starting point for looking at heat stress. There are a plethora of measures that have been used (WBGT which you mention, Apparent Temperature, Humidex, UTCI and quite a few others). I am not aware of anyone having connected wet-bulb temperature and heat stress, until our 2010 paper. But if they did I’d like to know!
Cheers–
Steve, I was just going by the use of the wet bulb globe temperature which seems to be mostly weighted to reflect the wet bulb temperature. In any case, thanks for your work emphasizing the connection between heat stress on land and the convective thermodynamic constraints.