December 14th, 2023
Key Findings
- The authors have directly identified the signature of greenhouse gas increase and the associated global warming in long-term thermal wavelength satellite measurements, and demonstrate that the evolution of the Earth system in response to human influence can be tracked by this thermal signature.
- These thermal wavelength modeling and observational results uniquely illustrate the causes of global warming, as well as the effect of global warming on Earth’s infrared spectrum, showing the cause-and-effect observations of humanity’s influence on climate in detail never seen before.
- This study shows that we can now directly monitor the heat impact of greenhouse gas concentration changes, much like the Keeling Curve for carbon dioxide concentrations.
Shiv Priyam Raghuraman, David Paynter, V. Ramaswamy, Raymond Menzel, and Xianglei Huang. Geophysical Research Letters. DOI: 10.1029/2023GL103947
Greenhouse gas emissions from human activities trap heat (radiative forcing) and cause global warming. This warming is amplified or diminished by feedbacks in the climate system. We had limited direct observations of global greenhouse gas forcing and feedbacks, despite the fact that they are the primary causes of climate change. While it has long been known that resolving the thermal spectrum at different wavelengths can help us to better separate the signals due to forcings and feedbacks, observing this has been elusive because of irregular, uncalibrated, or limited measurements. However, the Atmospheric Infrared Sounder (AIRS) instrument on NASA’s Aqua Satellite has recently provided such data (2003-2021).
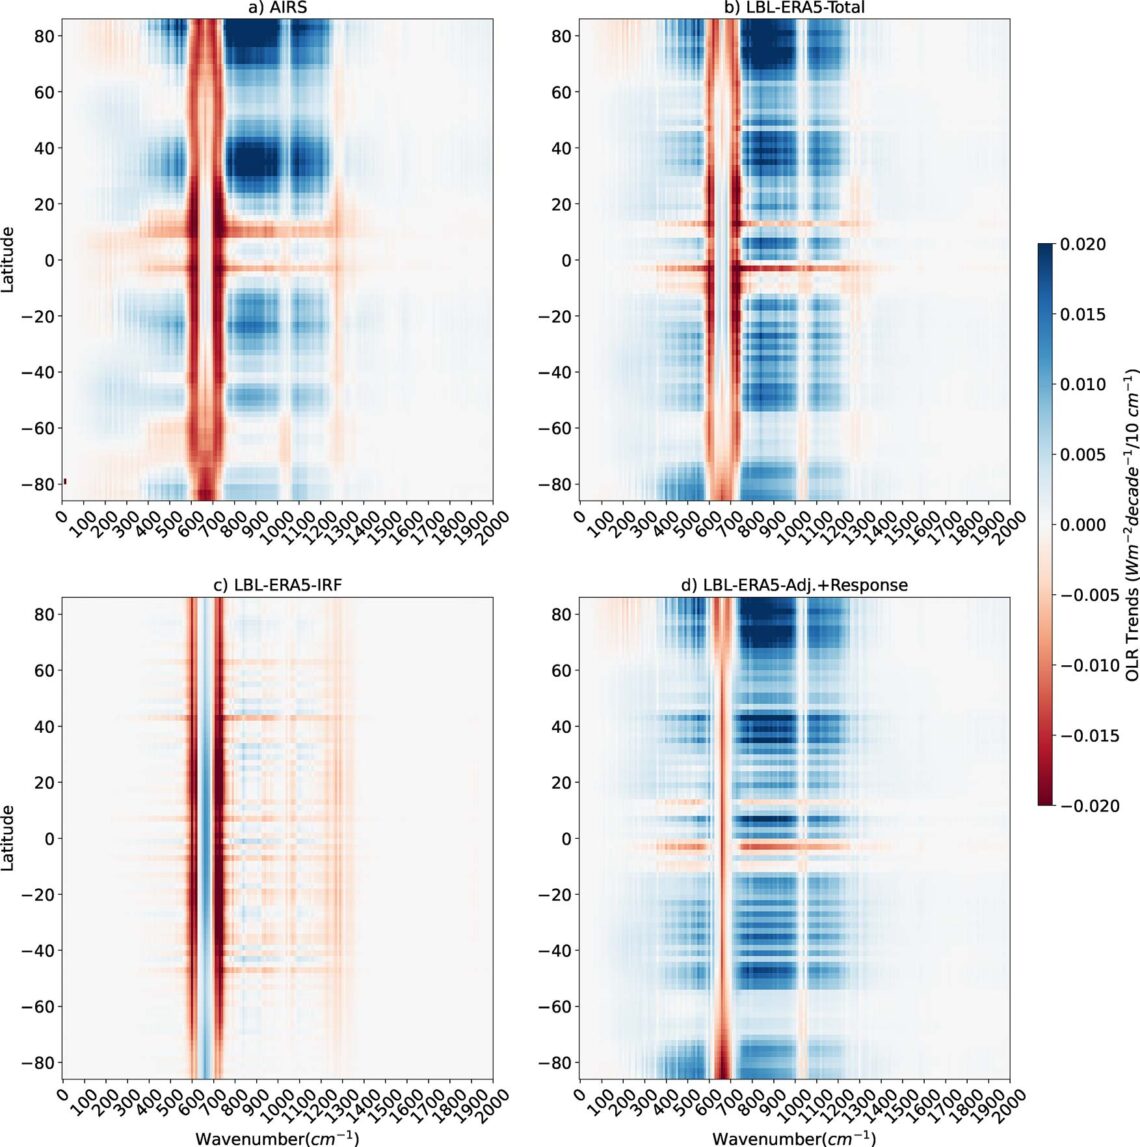
To demonstrate that the forcing and feedback signals appearing in the AIRS thermal spectra (Figure 1a) are consistent with the predictions of state-of-the-art climate models and reanalysis data, the authors conducted novel climate change simulations with several of GFDL’s models (AM3, AM4, CM3, and a radiation model, GFDL-GRTCODE) at each thermal wavelength, month, and location across the globe during 2003-2021. Excellent agreement is seen between AIRS measurement (Figure 1a) and the GFDL model result (Figure 1b). The authors show that increases in greenhouse gas (CO2, CH4, and N2O) atmospheric concentrations caused the observed increases in the heat trapped at wavelengths associated with those gases via an instantaneous effect (Figure 1c). These simulations show that the climate responded through a cooling of the stratosphere, warming of the surface and troposphere, with emission of extra heat to space via the wavelengths associated with H2O absorption bands and the transparent sections of the infrared spectrum (Figure 1d). Thus, the spectral trends predicted by the climate change simulations identify three bedrock principles of the physics of climate change in the satellite record: an increasing greenhouse effect, stratospheric cooling, and surface-tropospheric warming.
Previous modeling studies had simulated changes in the future infrared spectrum due to increases in CO2. This study shows that these spectrally-resolved changes are already occurring in the present-day climate given the CO2 increases that have occurred thus far. This framework allows for the determination of global, time-varying, spectrally-resolved forcing and feedbacks.