December 1st, 2023
Key Findings
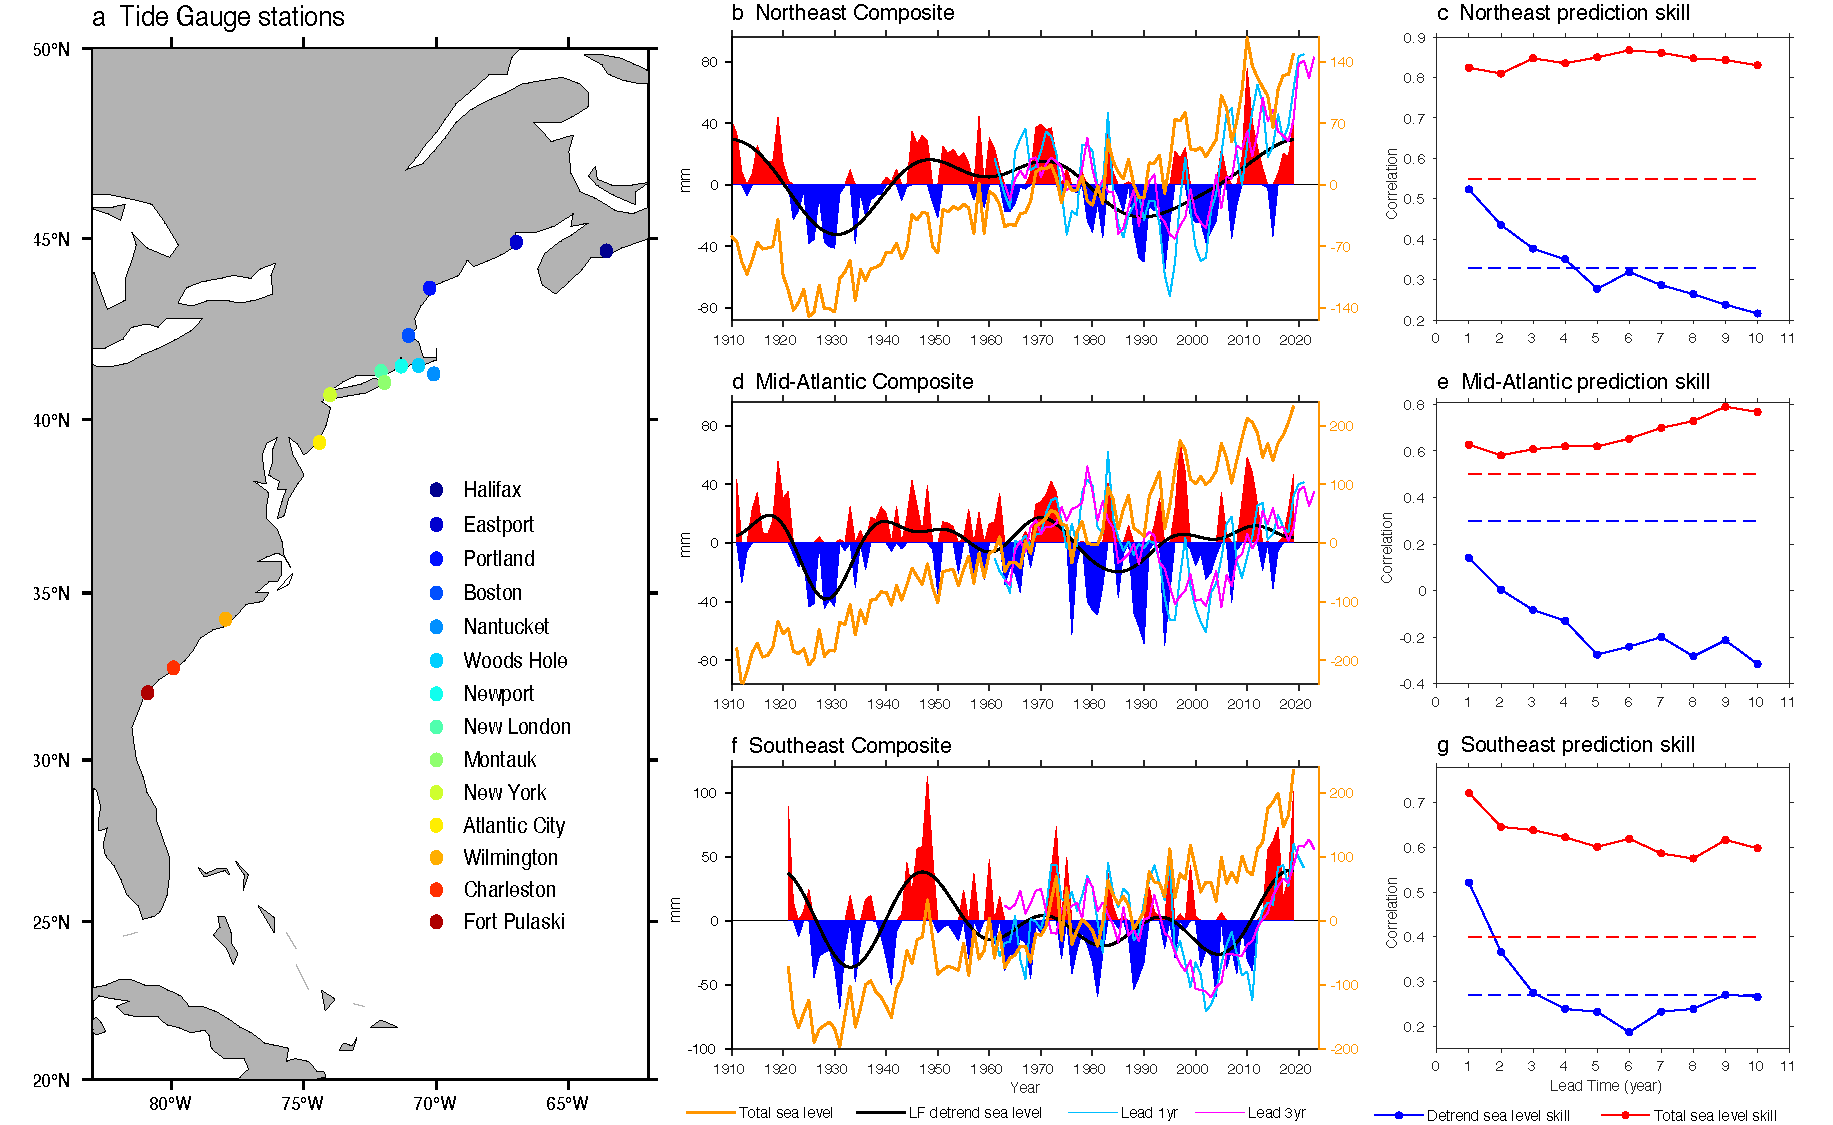
- The authors use observations and SPEAR climate model predictions to show that sea level variations along the U.S. East Coast are skillfully predictable 3 to 10 years in advance over the North Atlantic regions.
- The most predictable sea level component is characterized by a basin-wide upward trend. This trend-like component is highly predictable at least 10 years ahead in SPEAR decadal hindcasts.
- The second and third predictable sea level components are related to the AMOC mature state and transition state, respectively.
- These AMOC-related components are also clearly seen in control simulations, which have potential predictability up to 5-7 years in a perfect model context. Model biases and initialization uncertainties reduce the realized predictive skill to 3-5 years.
- The AMOC-induced dynamic sea level rise facilitates the trend-like sea level skill over the U.S. Northeast Coast. The detrended sea level skills along the U.S. East Coast are more related to the internal AMOC mature state in the Northeast regime, which can be predicted ~4 years ahead when verified by observations.
Liping Zhang, Thomas L. Delworth, Xiaosong Yang and Fanrong Zeng. Nature Communications Earth and Environment. DOI: 10.1038/s43247-023-01093-w
The occurrence of exceptionally high sea levels can cause severe coastal flooding and inundation, threatening lives and infrastructure in the coastal regions. High sea level also alters the coastal environment, moving barrier islands and cutting channels through them, impacting forests and crops, inundating the coastline with salt water, and damaging habitats essential to support wildlife.
The authors use observations and climate model predictions to show that sea level variations along the U.S. East Coast are skillfully predictable 3 to 10 years in advance. The most predictable component of sea level is a basin-scale upward trend, predictable a decade in advance and primarily a response to increasing greenhouse gases.
Significant additional predictability comes from multidecadal variations of the Atlantic Meridional Overturning Circulation (AMOC). While perfect model simulations show AMOC-related sea level predictability of 5-7 years, model biases and initialization uncertainties reduce the realized predictive skill to 3-5 years, depending on location. Overall, greenhouse gas warming and predictable AMOC variations lead to multiyear to decadal prediction skill for sea level along the U.S. East Coast. Such skills could have significant societal benefits for planning and adaptation.
Sea levels are impacted by many factors and can vary on broad time scales. On hourly to daily time scales, water level changes are primarily associated with the astronomical tide, waves, hurricanes, tropical cyclones, and extratropical storms. On seasonal to multidecadal time scales, sea level changes are usually linked to large scale ocean dynamics and climate variabilities. In response to anthropogenic warming, sea levels have a secular rising trend over most oceans due to thermal expansion and the melting of land ice.
It is critical for NOAA to improve forecast accuracy, precision and efficiency to save lives and property and support a vibrant economy. This study provides critical new understanding of the potential predictors in predicting multi-year sea level variabilities along the U.S. East Coast. Further, this research raises the possibility that the U.S. East Coast sea level may be predictable on multiyear time scales, and the authors are currently working on developing modeling tools to be able to predict such future changes.