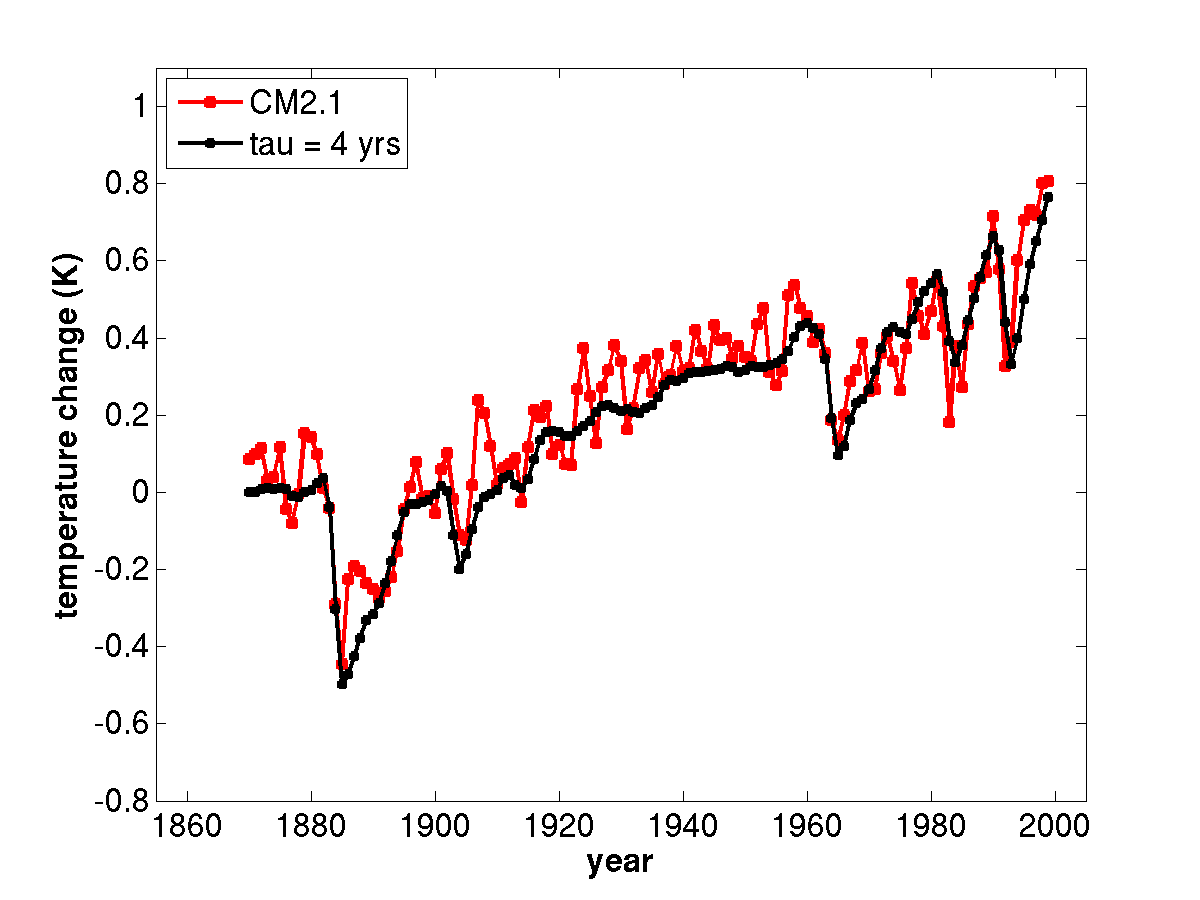
An estimate of the forced response in global mean surface temperature, from simulations of the 20th century with a global climate model, GFDL’s CM2.1, (red) and the fit to this evolution with the simplest one-box model (black), for two different relaxation times. From Held et al (2010).
When discussing the emergence of the warming due to increasing greenhouse gases from the background noise, we need to clearly distinguish between the forced response and internal variability, and between transient and equilibrium forced responses. But there is another fundamental, often implicit, assumption that underlies nearly all such discussions:the simplicity of the forced response. Without this simplicity, there is little point in using concepts like “forcing” or “feedback” to help us get our minds around the problem, or in trying to find simple observational constraints on the future climatic response to increasing CO2. The simplicity I am referring to here is “emergent”, roughly analogous to that of a macroscopic equation of state that emerges, in the thermodynamic limit, from exceedingly complex molecular dynamics.
The eastward component of the wind in the lower troposphere (850 hPa) simulated by an atmospheric model with roughly 50km horizontal grid.
(1 frame/6 hours for one full year, starting in January)
To help introduce myself, I’m starting with a post on a topic that I’ve been working on recently: the simulation of tropical cyclones in global atmospheric models.
Climate models are gradually moving to finer spatial resolution. Our lab is actively developing global atmospheric climate models with roughly 50 and 25 km grid spacing (even finer models are being run very experimentally), and there are a number of related efforts around the world. (In comparison, horizontal resolutions in most of the global atmospheric models referenced in the IPCC’s 4th assessment are of the order of 100-300km). The animation above is from a 50km model, and shows the lower tropospheric winds over a year of simulation. More precisely, it shows the east-west component of the wind vector (white => westerly –that is, from the west; black=> easterly) in the lower troposphere, on a constant pressure surface as is customary in meteorology. The actual surface protrudes above this level in places, especially the Tibetan plateau, and in those areas we use the near-surface wind instead, to avoid having to mark the data as missing in the animation. I like plotting the east-west (zonal) component like this, with a gray scale — it gives one the feeling of looking at a 3d contour map of sea-level pressure, lighted from the south in the Southern Hemisphere and from the north in the Northern Hemisphere (because the east-west component of the winds is closely related to the north-south gradient of the pressure).
I want to focus here, not on the dominant mid-latitude waves that are associated with the highs and lows and jet stream meanders familiar from weather maps, but the small isolated vortices that form in the tropics. These seem to develop in a variety of ways and have sizes that are not well-resolved by the grid. Do they correspond with anything in the real world?
Infrared radiation emitted to space simulated by an atmospheric model under development at GFDL. (1 frame/3 hours for one full year, starting in January).
My goal in this blog is to provide a forum for discussion of climate dynamics, with an emphasis, but not an exclusive focus, on climate change. The level of discussion is meant to be appropriate for graduate students in atmospheric and oceanic sciences, but I hope that this type of discussion is also useful to students in other fields with good applied math, physics and/or engineering backgrounds, to practicing scientists in other fields, and to some of my own colleagues. Different threads will probably focus on different parts of this intended readership.
Comments will be heavily moderated to maintain a tone and a level of discussion appropriate for the intended audience. Moderation will likely be slow. Comments must be closely related to the topic under discussion. I hope to post something every other week, on average.
I am employed by NOAA (and also lecture and advise graduate students at Princeton University). The opinions that I express are mine and not official positions of NOAA. However, I consider working on this blog to be fully consistent with NOAA’s outreach and communications policies. Read the rest of this entry »


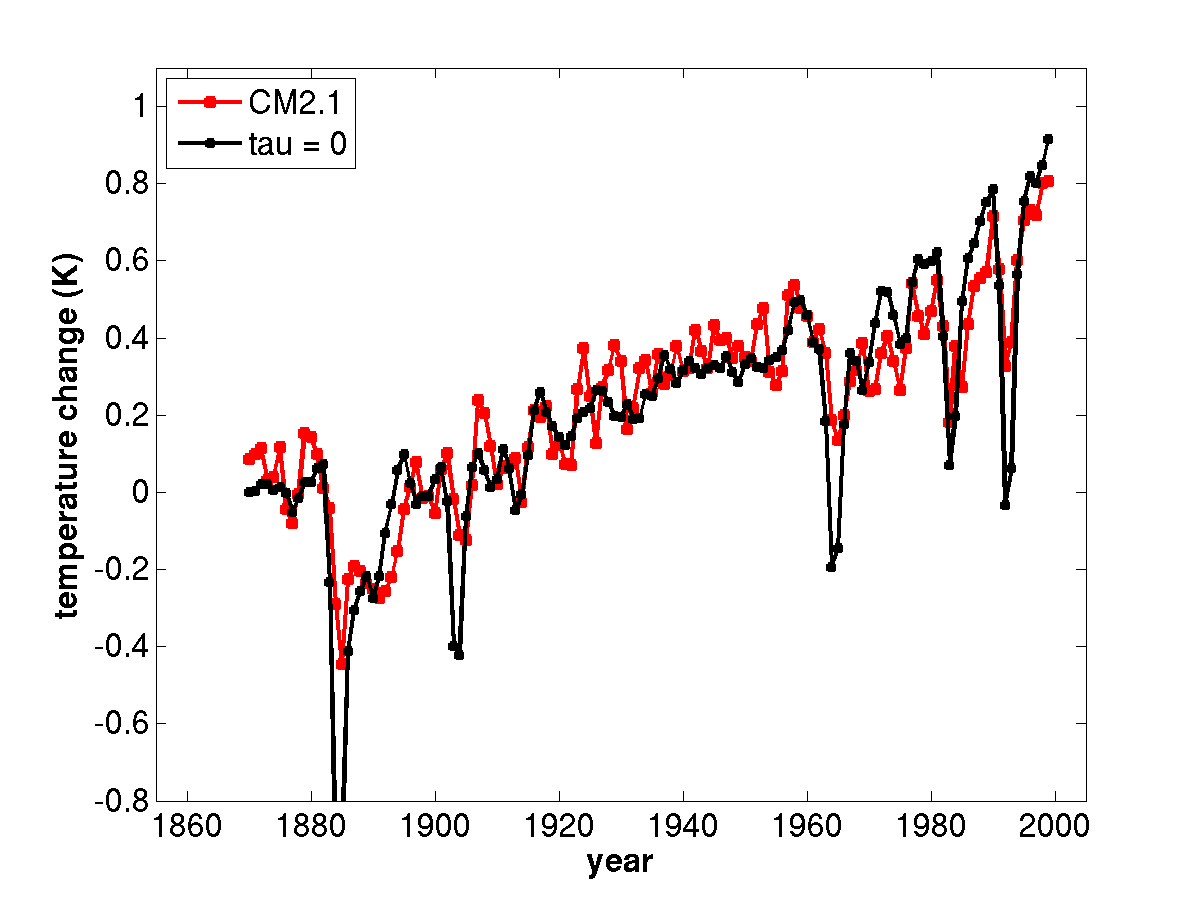 An estimate of the forced response in global mean surface temperature, from simulations of the 20th century with a global climate model, GFDL’s CM2.1, (red) and the fit to this evolution with the simplest one-box model (black), for two different relaxation times. From Held et al (2010).
Recent Comments